
Review Article | DOI: https://doi.org/10.31579/2637-8892/153
1 Physics Faculty, Department of General Physics, Lomonosov Moscow State University, Moscow, Russia.
*Corresponding Author: Sergey Belyakin, Physics Faculty, Department of General Physics, Lomonosov Moscow State University, Moscow, Russia.
Citation: Sergey Belyakin, Sergey Shuteev (2022) Application of a Time-Delay Model of the Plykin - Newhouse Attractor to Study the Dynamics of Neuro - Degeneration by Electroencephalography of the Brain. J. Psychology and Mental Health Care, 6(2): DOI: 10.31579/2637-8892/153
Copyright: © 2022, Sergey Belyakin, This is an open access article distributed under the Creative Commons Attribution License, which permits unrestricted use, distribution, and reproduction in any medium, provided the original work is properly cited.
Received: 09 December 2021 | Accepted: 06 January 2022 | Published: 22 January 2022
Keywords: neurodegeneration, neurons, chaotic dynamic, the attractor of the plykin - newhouse, method of pyragas, hyperbolicity
Neurodegeneration is the progressive loss of structure or function of neurons, which may ultimately involve cell death. Many neurodegenerative diseases-such as amyotrophic lateral sclerosis, multiple sclerosis, Parkinson's disease, Alzheimer's disease, Huntington's disease, and prion diseases-occur as a result of neurodegenerative processes. Neurodegeneration can be found in the brain at many different levels of neuronal circuitry, ranging from molecular to systemic. Because there is no known way to reverse the progressive degeneration of neurons, these diseases are considered to be incurable. Biomedical research has revealed many similarities between these diseases at the sub-cellular level, including atypical protein assemblies (like proteopathy) and induced cell death. These similarities suggest that advances against one neurodegenerative disease might ameliorate other diseases as well. In this report, an autonomous physical system is used, which is represented by a Smale Williams hyperbolic type attractor. Dynamics and evolution of neurodegeneration The Plykin-Newkhoz attractor model with the Piragas method is applied [1-10].
In mathematical theory of dynamical systems a class of uniformly hyperbolic strange attractors is known. In such an attractor all orbits are of the same saddle type, they manifest strong stochastic properties and allow detailed theoretical analysis. In textbooks and reviews, examples of these attractors are traditionally represented by abstract artificial constructions like the Plykin attractor and the Smale - Williams attractor. The simplest attractor of Plykin type is constructed with mapping of a domain of a plane with holes into itself. To construct a system with the Plykin attractor let us start with a map of a unit sphere defined as a sequence of four periodically repeating stages of continuous transformations. Duration of each stage is taken to be equal to a unit time interval. The holes will correspond to neighborhoods of four points A, B, C, D on the spere. Let us define the first stage as a flow of the representative points along circles of lattitude away from the meridians AB and DC. The second stage is differential rotation around z-axis with angular velocity depending on z linearly, in such way that the points B and C do not move, while the points A and D exchange their location. The third and the fourth stages are similar to the prevous two, but differ in the spatial orientation: the axes x and z exchange their roles. The fig.1 illustrates the the transformations geometrically, and differential equations for all the stages are written down [11].

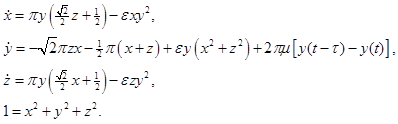
The realization of an Hyperbolic Plykin - Newhouse attractor on a sphere is represented by the equation [12] (1).

The realization of an Hyperbolic Plykin - Newhouse attractor on a sphere is represented by figure 2, figure 3.
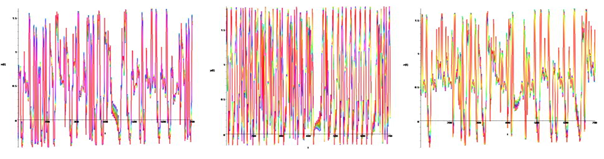

Figure 2 shows the temporal dynamics of y(t) of hyperbolic Plykin - Newhouse attractor on a spherical surface if ε = 0.72. Fig.3 left shows temporal dynamics of y(t) and the Fourier spectrum on the right presents the temporal dynamics of y(t) and wavelet transform hyperbolic Plykin - Newhouse attractor on a spherical surface if ε = 0.72. Hyperbolic Plykin - Newhouse attractor on a spherical surface in figure 1. and figure 3 show the bifurcation and chaotic.
For control and synchronization of hyperbolic Plykin - Newhouse attractor on a spherical surface we apply the method of Pyragas [13] by the equation (2).
For dynamics (μ/τ) of hyperbolic Plykin - Newhouse attractor on a spherical surface we apply the method of Pyragas by figure 4.


Fig.6 shows on the left the temporal scale amplitude y(t), to the right of the phase portrait of y(x), in the absence of external influence on the attractor. It is easy to see that, at these parameter values the attractor has strong chaotic properties.
When using the method of Pyragas μ = 0.1→1.0, ε = 0.72, τ = 1.9 is observed evolutionary dynamics of phase portraits of the system shown in Fig.6.

A positive impact on the attractor the attractor translates the pole on the positive sector of the equator. Attractor points A, B, C and D closer together forming a stable periodic attractor.

For transformation of flat system back to the spherical model we use the system of equations (2). Fig.7 shows on the left the temporal scale amplitude y(t), to the right of the phase portrait of y(x), in the absence of external influence on the attractor. It is easy to see that, at these parameter values the attractor has strong chaotic properties.
When using the method of Pyragas μ = − 0.1→ − 1.0, ε = 0.72, τ = 1.9 is observed evolutionary dynamics of phase portraits of the system shown in Fig.7.
In case of positive or negative impact (± K), the change of state from not stable to stable state is made by a jump.
And the hyperbolic attractor degenerates into the limiting cycle, and the continuous spectrum corresponding to chaotic oscillations changes into an equidistant one with the frequencies corresponding to the basic frequency and its harmonics. Thus, the application of the method of Pyragas at a constant time delay, gives the opportunity to observe the evolutionary dynamics of systems of hyperbolic Plykin - Newhouse attractor [13].
In case of positive or negative impact (± μ), the change of state from not stable to stable state is made evolutionarily.

The right graph of Fig.8 of the positive scan corresponds to the first graph of Fig.3. The negative scan of the left Fig.8 where the red spots are located corresponds to the fifth graphs of Figure (6,7).

Currently, it has become fashionable to identify the human brain with an array of neural network databases Fig.9 [14], although real networks look much more complicated Fig.10 [15].

The hyperbolic attractor degenerates into a limiting cycle, and the continuous spectrum corresponding to chaotic oscillations changes to equidistant with frequencies corresponding to the fundamental frequency and its harmonics. Thus, the application of the Piragas method with a constant time delay makes it possible to observe the evolutionary dynamics of neurodegeneration using this mathematical model.
Dear Editorial Team, Clinical Medical Reviews and Reports. My experience with the journal was highly positive. The peer-review process was rigorous, constructive, and completed in a timely manner. The reviewers provided valuable comments that helped improve the quality and clarity of our manuscript. The editorial office was professional, responsive, and supportive throughout all stages of the publication process. Communication was clear and efficient, and any questions were addressed promptly. Overall, I found the journal to maintain high scientific standards and an excellent publication workflow. I would be pleased to consider submitting future work to this journal. Best wishes from, Elena Popa.

It was my pleasure to submit my testimonial concerning the Reviewer Board of our Scientific Journal “Brain and Neurological Disorders”. The Reviewers focused on some modifications and their contribution was helpful. The ladies of our Editorial Office were also supported my efforts. It was my honor to have such a co-operation and I am looking forward for more collaboration.

Dear Grace Pierce, Editorial Coordinator of Journal of Clinical Research and Reports, Thank you for the speedy and efficient peer review process. I appreciate the fact that your peer reviewers do not take months to respond like with some other journals. I would also like to thank the editorial office for responding quickly to my questions. It is an excellent journal. I plan to submit more manuscripts in the future. Best wishes from, Robert W. McGee

Dear Grace Pierce, Editorial Coordinator of Journal of Clinical Research and Reports, Working with you and your team on our recent publication in JCRR has been a truly wonderful and enjoyable experience. The responses were prompt, and the reviewers were patient, constructive, and highly professional. One reviewer in particular gave me the feeling that a professor was carefully reading and commenting on my coursework, which was deeply touching. The entire process was straightforward and hassle‑free, with no tedious online forms to complete. I highly recommend this journal. Best wishes from, DR Aibing Rao, Head of R&D

I Appreciate the Opportunity to Share my Experience with the Journal of Clinical Research and Reports. The peer review process was timely and constructive, and the feedback provided helped improve the quality of our manuscript. The editorial office was professional, responsive, and supportive throughout the process, ensuring smooth communication and efficient handling of the submission. Overall, it was a positive experience collaborating with your team.

Dear Mercy Grace, Editorial Coordinator of Obstetrics Gynecology and Reproductive Sciences, We would like to express our gratitude for your help at all stages of publishing and editing the article. The editors of the magazine answer all the necessary questions and help at every stage. We will definitely continue to cooperate and publish other works in the Obstetrics Gynecology and Reproductive Sciences! Best wishes from, Alla Konstantinovna Politova,
