
Research Article | DOI: https://doi.org/10.31579/2692-9759/098
*Corresponding Author: Akhil Mehrotra, Prakash Heart Station and Diagnostics Lucknow, India.
Citation: Akhil Mehrotra, (2023), 4Dimensional XStrain Echocardiography: M-mode and Tissue Doppler Estimation of Age and Gender Specific Normative Values of Aortic Stiffness in Healthy Adults During Covid-19 Pandemic, Cardiology Research and Reports. 5(3); DOI:10.31579/2692-9759/098
Copyright: © 2023, Akhil Mehrotra. This is an open-access article distributed under the terms of the Creative Commons Attribution License, which permits unrestricted use, distribution, and reproduction in any medium, provided the original author and source are credited.
Received: 21 April 2023 | Accepted: 05 May 2023 | Published: 12 May 2023
Keywords: aortic stiffness; aortic elasticity; 4d x strain echocardiography; TDI of aorta; healthy adults; Covid-19 pandemic
Background: The elastic properties of the aorta are modified in numerous cardiovascular and non-cardiovascular diseases. Multiple studies have evaluated aortic stiffness in myriads of disease state, albeit only few Indian studies have estimated the normal values of aortic stiffness in healthy population.
Objective: To the best of our knowledge, till date no research has been undertaken to determine the age and gender specific value ranges of aortic stiffness parameters in healthy subjects. Hence, in the present study we endeavored to estimate these values in our distinctive study groups of healthy adults.
Methodology: This was a prospective observational study in which 58 healthy adults were enrolled during the turbulent corona pandemic. Study group was of the age group 18-60 years of either sex and was arbitrarily divided into six groups. Exhaustive M-mode and Tissue doppler Imaging was performed by 4Dimensional XStrain echocardiography system for extensive evaluation of multiple M-mode and Tissue Doppler imaging derived parameters of Aortic stiffness and superior wall velocities of ascending aorta.
Result: AOS, AOD, Aortic strain, and elasticity modulus were greater in males. On the contrary Aortic superior wall velocities (SAO, EAO, and AAO) were higher in females. Increasing age lead to a decline in majority of stiffness parameters derived by M-mode echocardiography. Correspondingly EAO determined by TDI of superior wall of aorta, showed a deterioration with advancing age.
Conclusion: The authors report a normal range of M-mode and TDI derived values of Aortic stiffness of ascending aorta, in healthy Indian adults. Difference in magnitude of aortic elasticity indices has been demonstrated in men and women, as well as in different subsets of the study group.
Functional sproperties of the aorta are major determinants of normal cardiovascular (CV) function [1]. Increments in aortic stiffness and reduction in aortic distensibility (indicators of elastic properties of aorta) are associated with coronary artery disease [2, 3]. Aortic elasticity is an established methodology for risk stratification of atherosclerotic heart disease, myocardial infarction, stroke and heart failure [3].
Numerous methods have been employed for the evaluation of aortic elasticity, namely magnetic resonance imaging (MRI), aortic angiography applantation tonometry, velocity vector imaging, and gated radionuclide angiography [4-8]. Moreover M-mode and Tissue Doppler Imaging (TDI) of the ascending aorta is also used to estimate its elastic properties [9-14].
The elastic properties of the aorta are modified in numerous CV and non-cv diseases. Hypertension, mitral valve prolapses, aortic aneurysms, coronary artery disease and heart failure, being the major cv disease and cystic fibrosis, pregnancy, chronic kidney disease, hypothyroidism, sarcoidosis, αl-antitrypsin deficiency and diabetes, being the non-cv diseases, altering the aortic stiffness properties [15-24].
Even though aortic stiffness has been evaluated in myriads of disease states, in contrast only few Indian studies have assessed the normal values of aortic stiffness parameters in healthy population [25, 26]. Till date, no research has been undertaken to determine the age and gender specific value ranges of aortic stiffness parameters in healthy subjects. Hence, in the present study we endeavored, to determine the above-mentioned normative values in our distinctive study groups of healthy population.
This study was carried out at Prakash Heart Station and Diagnostic centre, Lucknow, India. This was prospective, observational study in which 258 healthy Indian adults were recruited, and later on, 200 cases were omitted due to inferior image quality. Finally, 58 participants were enrolled during a period of 9 months from September 2021 to May 2022. Study group was of the age group 18-60 years of either sex, and was arbitrarily divided into six groups:
Those participant were included, if they were asymptomatic with a normal physical examination BMI-23 or less, waist size 85 cm2 or less in men and 80 cm2 or less in women, free from overt cardiovascular disease, not receiving any drugs, nonsmoker, nontobacco chewer, nondiabetic, non-hypertensive according to JNC-8 guidelines, having normal thyroid and lipid profile, normal resting electrocardiogram (ECG) in sinus rhythm with a normal two-dimensional echocardiography and Treadmill Stress ECG. Those individuals were excluded if there was presence of diabetes mellitus, neurological or psychiatric illness, malignancy, CAD, Aortic root abnormalities and aortic dilatation thyroid disease, valvular heart disease, history of cardiac rhythm abnormalities, heart failure, systemic hypertension, and significant pulmonary hypertension.
The study procedure was approved by the Institutional Ethics Board of Prakash Heart Station and Diagnostic, Lucknow, India. All subjects or their guardians gave their written informed consent prior to data collection and furthermore confidentiality of patient information was maintained.
Data collection and study procedure
All patients underwent full history taking, clinical examination, and a standard resting 12-lead ECG. A negative Covid-19 reverse transcription polymerase chain reaction report conducted within 72 h prior to the data of enrollment and echocardiography, was the essential requirement because the study was conducted during the raging Covid-19 pandemic.
Biochemical and Hormonal Assessment
After 12 h of overnight fasting, blood samples were withdrawn for HBAIC, T3T4TSH, Serum creatinine, Total cholesterol, Triglycerides, low-density cholesterol and high-density cholesterol. These estimations were done to rule out the presence of diabetes mellitus, hypothyroid or hyperthyroid state, renal failure, and dyslipidemia.
Blood pressure measurement
Blood pressure (BP) levels were measured from the right brachial artery at the level of the heart with a mercury sphygmomanometer after resting for at least 5 minutes in the supine position. Three measurements, at least 2-minute apart, were performed, and the average of the closet two readings was recorded. A pressure drop rate of approximately 2 mm Hg/S was applied, and Korotkoff ’s phases I and V were used for systolic and diastolic BP (SBP and DBP, respectively) levels. All BP measurements were made by a cardiologist. Pulse pressure (PP) was calculated as systolic minus diastolic BP.
Echocardiography
All echocardiographic evaluations were performed by the author, using- My Lab X7 4D X Strain echocardiography machine, Esaote, Italy. The images were acquired using a harmonic variable frequency (1-5 MHz) electronic single-crystal array transducer with the subject lying in left lateral decubitus position.
Conventional Echocardiography
M-mode, 2-Dimensional and pulsed wave doppler (PWD) echocardiography was performed from parasternal long-axis, short-axis and apical 3 chamber, 4 chamber and 2 chamber views and the following data were derived: Interventricular septum thickness in diastolic and systolic (IVSD and IVSs respectively), left ventricular posterior wall thickness in diastole and systole (LVPWD and LVPWs, respectively), left ventricular end-diastole and end systole volumes (LVEDV and LVESV, respectively). Moreover, 2-Dimensional ejection fraction (2D-EF Percentage) by biplane Simpson’s method, LV mass in diastole (LV Mass d) and cardiac out-put (CO) were also determined. Cardiac Index was calculated by dividing the CO by body surface area (BSA). By using PWD, early diastolic velocity (E), late diastolic velocity (A), and E/A ratio was measured.
Aortic stiffness assessment by M-mode echocardiography of Ascending Aorta
Systolic and diastolic inner diameter of ascending aorta were recorded by M-Mode echocardiography 3 cm above the aorta valve in a parasternal long-axis image. Aorta systolic diameter (AOS) was measured at the maximum anterior motion of the aorta, and aorta diastolic diameter (AOD) was measured at the peak of QRS complex on the recorded ECG. (Figure 1, 2). All the parameters were computed and the average of 5 consecutive cycles were calculated.
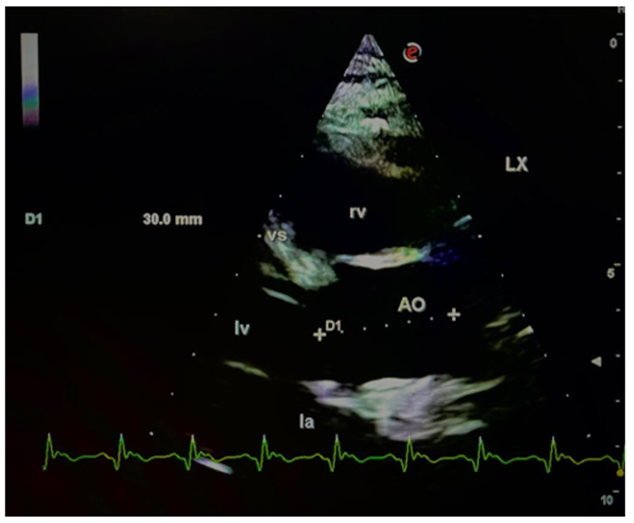
Figure 1: Measurement of aortic diameter obtained at 3 cm above the aortic cusps.
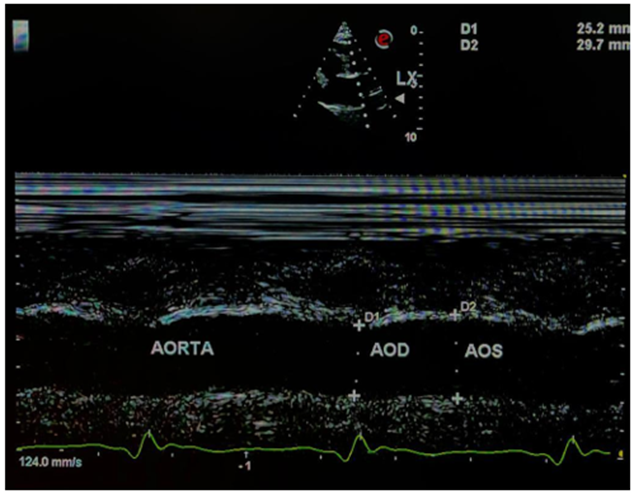
Figure 2: Aorta visualized on M- mode. The movement of aortic wall appears as two wavy lines. The space between the two lines is the aortic lumen. Systolic and diastolic diameters are measured on M- mode.
Aortic distensibility (D), aortic stiffness index (SI) and other elasticity parameters were determined by using the following formulas [27, 28].
ASysI, ADI and API were calculated by dividing AOS, AOD and APC by body surface area (BSA), respectively
Tissue Doppler imaging of Ascending Aorta
Aortic upper-wall velocities were measured by Tissue Doppler Imaging (TDI) at the same point as in the M-mode measurements (Figure 3) gain and filter were adjusted to optimize the image. High temporal resolution (Greater than100 frames/s) and a sweep speed set to 100 mm/s were used. The TDI of expansion peak velocity during systole (SAO) and early (EAO) and late (AAO) contraction peak velocities during diastole were obtained with a 1-mm sample volume size.

Figure 3: Tissue Doppler Imaging of the ascending aorta. The measurements were made at a level of 3 cm above the aortic cusps, at the same point as that for M-mode echocardiography.
The resulting velocities were recorded for 5 consecutive cardiac cycles and stored for later playback and analysis.
Following data were estimated by TDI of the superior wall of ascending aorta (Figure 4).

Figure 4: Aortic superior wall velocity measurements with tissue doppler imaging. SAO, systolic superior wall velocity, EAO, early diastolic superior wall velocity, AAO, late diastolic superior wall velocity.
Tissue Doppler Echocardiography of left ventricle
TDI of LV was conducted by placing the PWD sample volume at the lateral mitral annulus in apical four-chamber view, and early diastolic velocity (E’) and E/E’ ratio was determined in the TDI mode.
Four-dimensional XStrain speckle-tracking echocardiography
From the apical position, two-dimensional cine loops were acquired from two-chamber, three-chamber, and four-chamber views. High-quality ECG signal was must for proper gating, and a minimum of three cardiac cycles were acquired of each cine loop. The study was performed with a frame rate between 40 and75 fps and then stored digitally on a hard disk for offline analysis by software package XStrainTM advanced technology TOMTEC GMGH 3D/4D rendering Beutel TM computation capabilities (Figure 5) [29].

Figure 5: X Strain 4D global LV analysis. At the end of each scanning section, the three apical views are acquired. Then, after left ventricular (LV) endocardial border tracking, the software analyzes LV regional deformation parameters. Finally, the Beutel 3D reconstruction allows quantification of global LV function (global longitudinal strain (GLS)—ejection fraction). X Strain TM 4D.
The LV endocardial and epicardial borders were identified, tracked, and highlighted by a semiautomatic tool-AHS Aided Heart segmentation Esaote, for border segmentation. Thirteen equidistant tracking points were automatically incorporated along the LV endocardial border and where necessary manual adjustment of endocardial tracing was done. The software automatically divided the LV wall into 6 segments and them the acquired cine loop of each apical view was tracked frame by frame throughout the entire cardiac cycle. The cine loops with inadequate tracing quality and with any signs of arrhythmia were excluded.
The LV bull’s eye depiction according to 17-segment model was generated by XStrain 4D software, by integrating the results of each set of cine loops [30, 31]. XStrain-4D software created a 3D reconstruction for calculating LV volumes and EF [32], and XStrain 4D-EF by the “Beutel Mode” method (TOMTEC, Germany) (Figure 6) [33].
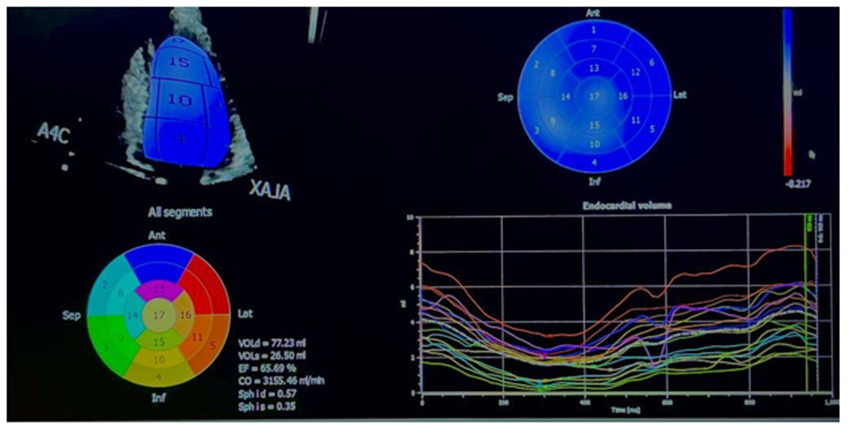
Figure 6: XStrain 4D software created a 3D reconstruction for calculating LV volumes and XStain 4D-EF by the “Beutel Mode” method (TOMTEC, Germany).
XStain 4D-EF by the “Beutel Mode” method (TOMTEC, Germany).
The following 4D XStrain estimated values of volumetric values were statistically analyzed.
Statistical analysis was performed with the Microsoft excel® (Excel 2019.Microsoft corp. Seattle Washington. USA). The continuous variables are expressed as mean ± SD. The 95Percentage confidence interval of mean was also calculated. Enrolled participants were stratified according to Groups A-F, age: Less than 30 years and Greater than 31 years and gender: male and female. Comparison of various datasets between men and women and between different age groups was performed by Students t-test for independent groups.
The level of significance used was Less than0.05. A higher t value having a probability Less than0.05 was marked significant. A p value Less than0.01 was marked highly significant.
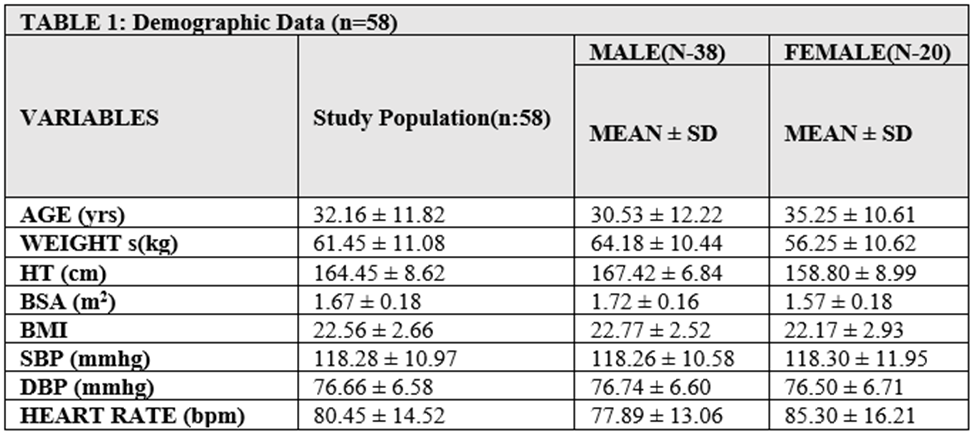
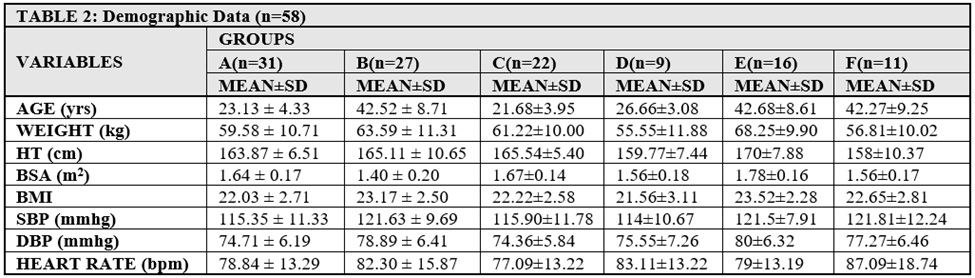
We performed Aortic stiffness assessment of ascending aorta in 58 healthy Indian adults of age 18-60 years mean 32.16±11.82 years, free from overt cardiovascular disease (Table 1). The study population was arbitrarily divided into six groups: Group A from 18-30 years of age, Group B from 31-60 years of age, Group C, male subjects of 18-30 years, Group D, female subjects of 18-30 years, Group E, male subjects of 31-60 years and Group F, female participants of 31-60 years.
NS=Not Significant (p Greater than0.05), ** Highly Significant=(p Less than0.01), * Significant=(p Less than0.05)
The mean BSA of the participants was 1.67±0.18 sq. meter. There were 38 males and 20 females with a mean age of 30.53±12.22 years and 35.25±10.61 years respectively, and a mean BSA of 1.72±0.16 sq. meter and 1.57±0.18 sq. meter respectively (Table 1). The mean age in Group A-E was 23.13±4.33 years, 42.52±8.71 years, 21.68±3.95 years, 26.66±3.08 years, 42.68±8.61 years and 42.27±9.25 years respectively and mean BSA was 1.64±0.17m2, 1.40±0.2m2, 1.67±0.14m2, 1.56±0.18m2, 1.78±0.16m2, 1.56±0.17m2, respectively (Table 2).
NS=Not Significant (p Greater than0.05), ** Highly Significant= (p Less than0.01), * Significant= (p Less than0.05)
Group A: overall subjects (age18-30 years), Group B: overall subjects (age 30-60 years) Group C: Male Subjects (age 18-30yrs),
Group D: Female Subjects-(age 18-30yrs), Group E: Male Subject-(age 31-60yrs), Group F: Female Subjects-(age 31-60yrs)
LA size, E/A ratio, Lateral TDI E’ and Lateral TDI E/E’ ratio are surrogate measurements for assessment of diastolic function of LV and LVIDd, LVEDV, EPSS and EFPercentage are representative of systolic function. In our study LA size, E/A ratio, lateral TDI E’, LVIDd and LVEDV were significantly higher in males (pLess than0.01) even though CO & 2D-EFPercentage was higher in females (pLess than0.01) (Table 3). Additionally E/A ratio and 2D-EFPercentage were lower in Group B when compared with Group A (pLess than0.01), suggesting a reduction in diastolic & systolic function of LV, with increasing age.
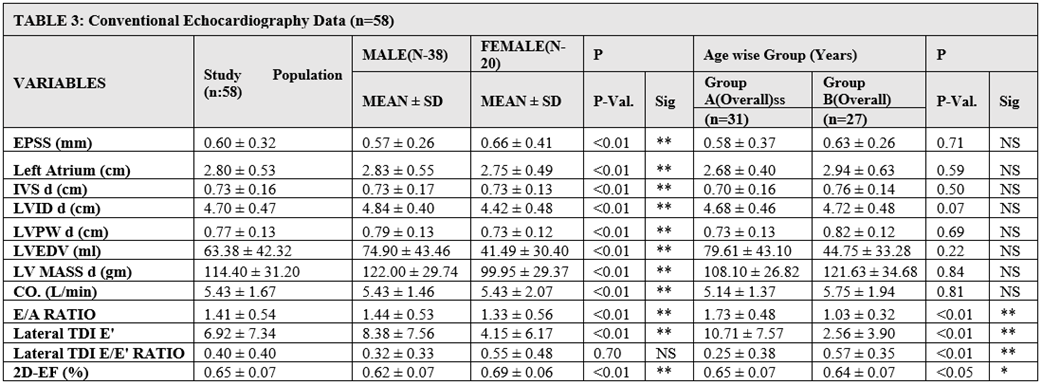
EPSS, E point septal separation, IVSd, interventrciualr septum in daistole, LVPwD, Left ventricualr posterior wall in diastole, LVID, left ventricular, internal dimension LVEDV, Left ventricular end-diastole volume, CO, cardiac output, TDI, Tissue doppler imaging, EF, ejection fraction
NS=Not Significant(p Greater than0.05), ** Highly Significant=(p Less than0.01), * Significant=(p Less than0.05)
Group A: overall subjects (age18-30 years), Group B: overall subjects (age 30-60 years)
The sphericity index in diastole and systole, LVEDV and LVESV were higher in males (pLess than0.01). Nevertheless, 4D-EFPercentage was more in female (pLess than0.01) (Table 4). We noticed a decline in sphericity indices in Group B as compared to Group A (pLess than0.05), suggesting a significant change in LV geometry with increasing age.
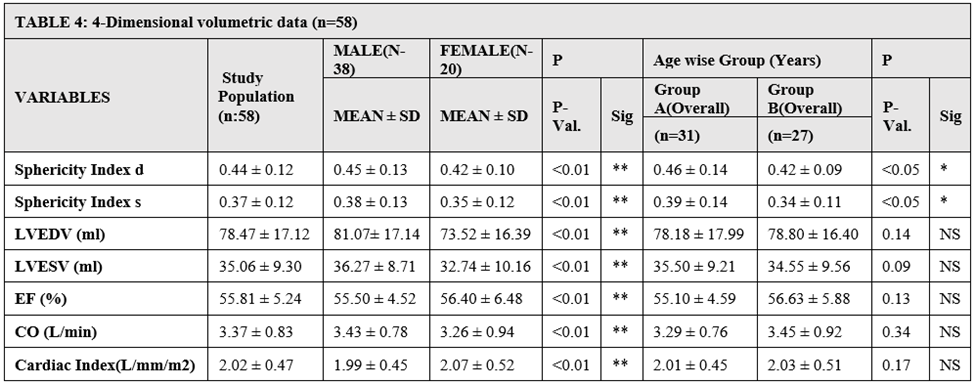
LVEDV, Left ventricular end-diastolic volume,LVESV,Left ventricular end-systolic volume,EF,ejection fraction,CO,cardiac output
NS=Not Significant(pGreater than0.05),** Highly Significant=(pLess than0.01),* Significant=(pLess than0.05)
Group A: overall subjects (age18-30 years), Group B: overall subjects (age 30-60 years)
M-Mode data of Aortic stiffness
AOS, AOD, Pulsatile change, Pulsatile index, Aortic Strain and Elasticity Modulus were greater in males (pLess than0.01), and Aortic distensibility was insignificant elevated (p=NS). On the contrary, Aortic Systolic index, Aortic diastolic index was higher in females (pLess than0.01) (Table 5). s
Furthermore, Pulsatile change, Pulsatile index, Aortic Strain were lower in Group B as compared to Group A (PLess than0.01), demonstrating a decline of these stiffness parameters with increasing age.
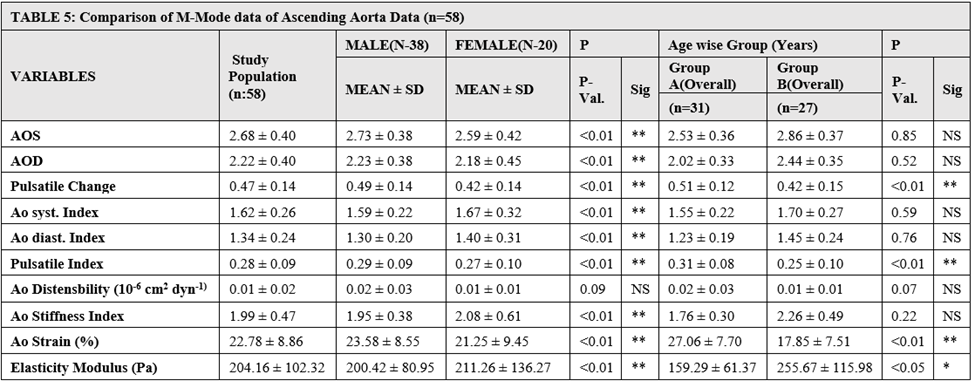
AOS, Aortic dimension in systole, AOD, Aortic dimension in diastole, Ao, Aorta
NS=Not Significant(p Greater than0.05),** Highly Significant=(p Less than0.01),* Significant=(p Less than0.05)
Group A: overall subjects (age18-30 years), Group B: overall subjects (age 30-60 years)
SAO, EAO and AAO were higher in females (pLess than0.01) (Table 6). It was also observed that EAO was lower in Group B, indicating a deterioration of in early diastolic upper wall velocity with aging. Contrarily SAO and AAO showed insignificant (p=NS) increment with increasing age.
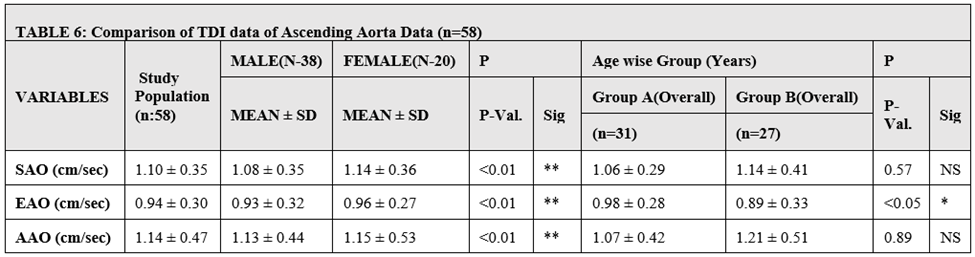
TDI, Tissue doppler imaging, SAO, Systolic upper velocity, EAO, Early Diatolic aortic upper wall velocity, AAO, late diastolic upper wall velocity
NS=Not Significant(p Greater than0.05),** Highly Significant=(p Less than0.01),* Significant=(p Less than0.05)
Group A: overall subjects (age18-30 years), Group B: overall subjects (age 30-60 years)
On comparing Group C and D (male and female subjects of age 18-30 years), it was shown that AOS, AOD, and Aortic Stiffness Index and Elasticity modulus were greater in males of 18-30 years of age (p Less than0.01), even though Aortic Strain was higher in females (p Less than0.01) (Table 7). Similarly, SAO, AAO and EAO reflected a lower value in Group D than Group C, indicating diminished aortic superior wall velocities in female subjects of age 18-30 years of age.

AOS, Aortic dimension in systole, AOD, Aortic dimension in diastole, Ao, Aorta TDI, Tissue doppler imaging, SAO, Systolic upper velocity, EAO, Early diastolic, aortic upper wall velocity, AAO, late diastolic upper wall velocity, Ao, Aortic
NS=Not Significant(p Greater than0.05),** Highly Significant=(p Less than0.01),* Significant=(p Less than0.05)
Group C: Male Subjects (age 18-30yrs), Group D: Female Subjects-(age 18-30yrs), Group E: Male Subjects-(age 31-60yrs), Group F: Female Subjects-(age 31-60yrs)
In addition, when we analysed the data of Group E and F (male and female subjects of age 31-60 years), it was noted that AOS, AOD and Aortic strain values were higher in Group E than Group F. Conversely, the SAO, AAO and EAO values were more in Group F, even though insignificantly (p=NS).
Interestingly, only Aortic strain was lower in Group E when compared to Group C (P Less than0.01), implying that aortic strain was deteriorating with increasing age in male subjects (Table 8). On the contrary AOS, AOD, Aortic stiffness index and Elasticity modulus were insignificantly higher is Group E (p=NS). We also observed that SAO values were higher and EAO values were lower in Group E (p Less than0.01), on comparing with Group C.
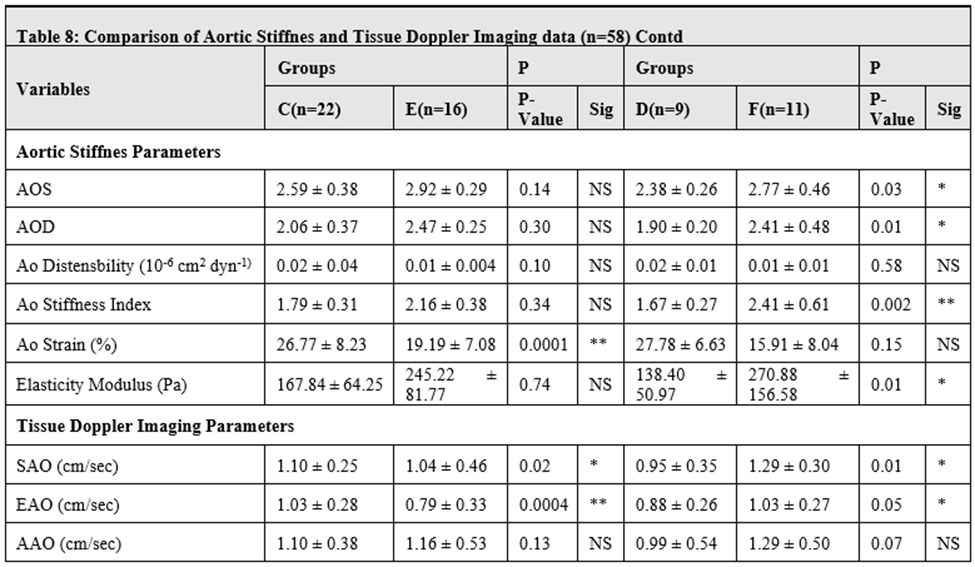
AOS, Aortic dimension in systole, AOD, Aortic dimension in diastole, Ao, Aorta TDI, Tissue doppler imaging, SAO, Systolic upper velocity, EAO, Early diastolic aortic, upper wall velocity, AAO, late diastolic upper wall velocity, Ao, Aortic
NS=Not Significant(p Greater than0.05), ** Highly Significant=(p Less than0.01), * Significant=(p Less than0.05)
Group C: Male Subjects (age 18-30yrs), Group D: Female Subjects-(age 18-30yrs), Group E: Male Subjects-(age 31-60yrs), Group F: Female Subjects-(age 31-60yrs)
Subsequently, on collating the Aortic stiffness data in female subjects (Group D and F) we found higher values of AOS, AOD, Aortic Stiffness Index and Elasticity modulus in Group F than D (p Less than0.05, p Less than0.05, p Less than0.01, p Less than0.05), suggesting that in female adults that there is decline in these stiffness parameters with advancing age. Simultaneously SAO and EAO were also higher in Group F (p Less than0.05).
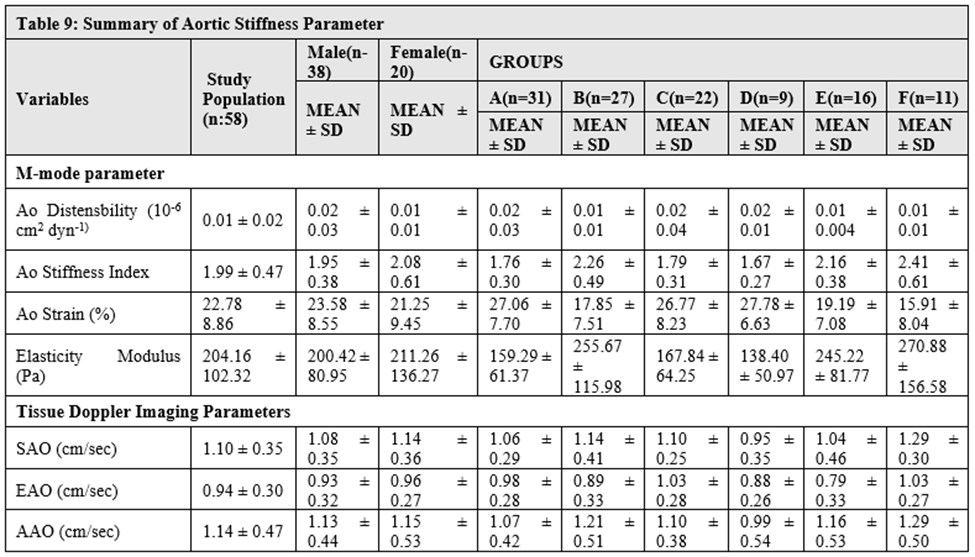
We have extensively estimated the Age and Gender specific values of Aortic Stiffness in various subsets of our study population. Here we are furnishing a summarized values (Table 9) of the above-mentioned parameters discerned from the current study. This table is particularly meant for contemporary and prospective medical researchers to conceptualize further on these interesting original findings.
It is well known that increased aortic stiffness has been associated with impaired LV systolic and diastolic functions. The association between increased stiffness and LV systolic dysfunction, has been demonstrated in a previous study [34], particularly along the long axis. The relation is often attributed to increased hemodynamic load caused by stiffer arteries [35, 36]. An alternative explanation for the observed relation between aortic stiffness and LV systolic function, is the direct mechanical ventricular-vascular coupling.
Systolic contraction shortens the LV long axis by pulling the aortic annulus and Sino-tubular junction of the aorta towards the LV apex, which moves minimally during systole [37-40]. The combination of aortic annulus displacement along with sparse movement of the aortic arch implies that there is substantial longitudinal stretch of the ascending aorta during systole [40-42].
Abhayaratna et al [43] assessed the relationship of arterial stiffness with LV diastolic dysfunction in 188 elderly individuals and found a significant correlation between central pulse pressure and severity of diastolic dysfunction and concluded that increased arterial stiffness was associated with more severe left ventricular diastolic dysfunction.
Arterial stiffness index establishes the elastic properties of the arterial wall, in a manner relatively independent of blood pressure, and aortic distensibility evaluates the ability of the arteries to dilate during the cardiac cycle [44-51].
Aortic stiffness and aortic distensibility have been examined with VVI and pulse wave velocity (PWV) [46, 52]. However, VVI is a new and invasive method, requiring transesophageal echocardiography, which limits its routine use in clinical practice. Also, PWV is not the ideal procedure to evaluate aortic elasticity properties since it is affected by many factors including hematological and physiological characteristics, as well as heart rate and blood pressure variations [53-55].
Direct measurements of aortic elasticity by TDI, which is a practical method for the measurements of diameter changes related to wall movements, may provide further help than other methods described above, because it is not affected by hematological and cardiovascular physiology [56-58]. Multiple articles have shown a link between loss of elasticity in major arteries and cardiovascular adverse events [57, 58]. In the Framingham Cardiology study, over 20 years of monitoring, increased pulse pressure, which is an indication of large vessel wall stiffness has been shown to increase coronary artery disease risk in the middle and older age group, who had no clinical coronary artery disease [59].
Hence the, determination of normal value ranges of Aortic stiffness parameters is imperative, because then only the normal values can be compared to the values obtained in different disease states.
A considerable amount of literature is available on the adverse impact caused by various disease states on the aortic stiffness parameters, nevertheless, it is exceptionally rare to find a study depicting these values in healthy population. After a deep search of the literature, we could only come across a solitary study [25] which has recently endeavored to put forward the normal values ranges of Aortic stiffness properties in healthy population by 2Dimensional and 4Dimensional XStrain Echocardiography. There were 72 healthy participants in the 2Dimensional group and 30 individuals in the 4D XStrain group. The results are analogous to the current study, even though there were small number of subjects in 4D XStrain group.
In the study of elasticity properties of ascending aorta in healthy children and adolescents [60] 165 subjects were enrolled with a mean age of 11.92±4.0 years. The mean age in our study group was 32.16±11.82 years and to compare their data with the present study would not be feasible. Another research study investigated the effects of subclinical hypothyroidism on elastic properties of the ascending [17]. This study had a strict inclusion criterion and they recruited 48 healthy controls with a mean age of 42±11 years. The values of their control group are incongruous with our study and the reason seems to be the disparity of mean age of the controls of their study and the healthy subjects of the present study. Correspondingly Vitarelli et al [14] reported in their 80 healthy controls, two-dimensional M-mode and TDI guided ascending aorta wall stiffness parameters. The mean age was 49±17 years and the values of stiffness index (SI), Aortic distensibility (D), elastic modulus (EM), SEO, AAO and EAO reflected gross incongruity with our study group. The divergence of results may be because of dissimilarities in the mean age of our study group and their control group (mean age 49±17 years).
Gungor et al [15] showed that aortic stiffness is increased in patients with premature coronary artery disease (CAD). In their study there were 50 patients of acute coronary (ACS) and 70 age sex matched controls. However, in their control groups there were 26 smokers and several were having hypertension, diabetes and hyperlipidemia controlled on medication. Nevertheless, the mean age in their study group was 34±3.9 years which is similar to our study. Since this study included, in their control group volunteers who were current smokers, controlled hypertensives, diabetics and hyperlipidemic therefore to collate the results of aortic stiffness in their control group with our study would not be meaningful.
Earlier studies mentioned above are in some way or the other, inharmonious with the present research work. We have extensively compared our data in healthy population by constructing various subsets of groups and then collating the values amongst them, in a judicious manner. The main results of our study can be outlined as follows: (i) we provided exhaustive data on several parameters of Aortic stiffness determined by M-mode and TDI echocardiography. (ii) Our study group was arbitrarily divided into six groups A-E (iii) 4Dimensional volumetric data : sphericity index, LVEDV and LVESV were higher in males and importantly, 4D-EF was more in females (iv) AOS, AOD, Aortic strain, and elasticity modulus were greater in males (v) On the contrary Aortic superior wall velocities (SAO, EAO, AAO) were higher in females (vi) Increasing age lead to a decline in parameters of sphericity index, and majority of stiffness parameters derived by M-mode echocardiography (vii) correspondingly EAO determined by TDI of superior wall of aorta, showed a deterioration with advancing age.
The echocardiographic method of determining the aortic stiffness using mathematical equations may have some limitations [56,57]. Firstly, blood pressure and pulse pressure measured at the level of brachial artery may not exactly reflect aortic pulse pressure and secondly, blood pressure measurement and aortic echocardiographic assessment cannot be carried out simultaneously. All the participants are of Indian ethnicity and the normal value ranges of the present study cannot be anticipated to be identical with other ethnic groups, particularly Caucasians.
Our study had modest number of subjects, because it was undertaken during the raging corona pandemic and to encounter a normal healthy subject during this period was an arduous task. Moreover, this is a single center experience.
Recommendations and future research directions
The authors recommend, in future large scale multiple centers randomized controlled trials for enrolling hundreds of healthy subjects to further investigate the important properties of Aortic stiffness.
The authors report normal range of M-mode and TDI derived values of Aortic stiffness of ascending aorta, in healthy Indian adults. Difference in magnitude of aortic elasticity indices has been demonstrated in men and women, as well as in different subsets of the study group.
Dear Editorial Team, Clinical Medical Reviews and Reports. My experience with the journal was highly positive. The peer-review process was rigorous, constructive, and completed in a timely manner. The reviewers provided valuable comments that helped improve the quality and clarity of our manuscript. The editorial office was professional, responsive, and supportive throughout all stages of the publication process. Communication was clear and efficient, and any questions were addressed promptly. Overall, I found the journal to maintain high scientific standards and an excellent publication workflow. I would be pleased to consider submitting future work to this journal. Best wishes from, Elena Popa.

It was my pleasure to submit my testimonial concerning the Reviewer Board of our Scientific Journal “Brain and Neurological Disorders”. The Reviewers focused on some modifications and their contribution was helpful. The ladies of our Editorial Office were also supported my efforts. It was my honor to have such a co-operation and I am looking forward for more collaboration.

Dear Grace Pierce, Editorial Coordinator of Journal of Clinical Research and Reports, Thank you for the speedy and efficient peer review process. I appreciate the fact that your peer reviewers do not take months to respond like with some other journals. I would also like to thank the editorial office for responding quickly to my questions. It is an excellent journal. I plan to submit more manuscripts in the future. Best wishes from, Robert W. McGee

Dear Grace Pierce, Editorial Coordinator of Journal of Clinical Research and Reports, Working with you and your team on our recent publication in JCRR has been a truly wonderful and enjoyable experience. The responses were prompt, and the reviewers were patient, constructive, and highly professional. One reviewer in particular gave me the feeling that a professor was carefully reading and commenting on my coursework, which was deeply touching. The entire process was straightforward and hassle‑free, with no tedious online forms to complete. I highly recommend this journal. Best wishes from, DR Aibing Rao, Head of R&D

I Appreciate the Opportunity to Share my Experience with the Journal of Clinical Research and Reports. The peer review process was timely and constructive, and the feedback provided helped improve the quality of our manuscript. The editorial office was professional, responsive, and supportive throughout the process, ensuring smooth communication and efficient handling of the submission. Overall, it was a positive experience collaborating with your team.

Dear Mercy Grace, Editorial Coordinator of Obstetrics Gynecology and Reproductive Sciences, We would like to express our gratitude for your help at all stages of publishing and editing the article. The editors of the magazine answer all the necessary questions and help at every stage. We will definitely continue to cooperate and publish other works in the Obstetrics Gynecology and Reproductive Sciences! Best wishes from, Alla Konstantinovna Politova,
