
Review Article | DOI: https://doi.org/10.31579/2690-8808/144
1 Anton Paar-TR, Kucukbakkalkoy Pasific Plaza B Blok, Ataşehir, Istanbul, Turkey
2 Faculty of Medicine, Department of Fundamental Medical Sciences, Kahramanmaraş Sutcu Imam University, Turkey
3 Department of Physics Engineering, Hacettepe University, Ankara, Turkey
4 Department of Life Science, National Tsing Hua University, Hsinchu, Taiwan
5 National Synchrotron Radiation Research Center, Hsinchu, Taiwan
*Corresponding Author: Ilghar Orujalipoor, Anton Paar-TR, Kucukbakkalkoy Pasific Plaza B Blok, Ataşehir, Istanbul, Turkey
Citation: : Ilghar Orujalipoor. (2022). Corruption in Olympic Sports: Prevalence Estimations of Match Fixing Among German Squad Athletes. Journal of Clinical Case Reports and Studies 3(8); DOI: 10.31579/2690-8808/144
Copyright: © 2022 Ilghar Orujalipoor, This is an open access article distributed under the Creative Commons Attribution License, which permits unrestricted use, distribution, and reproduction in any medium, provided the original work is properly cited.
Received: 12 September 2022 | Accepted: 26 September 2022 | Published: 04 October 2022
Keywords: retina; rhodopsin; X-ray scattering; SAXS; WAXS
The retina segments obtained from Mice-664 C57BL/6J eyeballs were investigated at 23A1 IASW- Beamline, NSRRC. Transmission small and wide-angle scattering (SAXS and WAXS) measurements and the related data were used to reach nanoscale natural morphology and internal structural information of ROS. Rhodopsin macromolecules in their natural medium (inside of the rods and retina) were successfully detected. The X-ray scattering effects of rhodopsin macromolecules in mice eyeball and surgically separated retina samples were carried out to reach the most natural situation of the molecules in the same animal species and to determine detection limits of rhodopsin macromolecules. The quantitative results about the structures of ROS membranes, rhodopsins and α-helices trans membranes were also carried out in nanoscopic scale.
The receptor organs for vision are eyes. It is one of the most complex organs in the body which gives us a sense of sight allowing vertebrae to learn more about the around the world. This organ works like a camera; light let on by the cornea is controlled by the pupil and is charged into electrical signals by the retina and sent to the brain where the signals are interpreted into visual images [1]. The eye is composed of eyeball, the optic nerves and the accessory structures; eyeballs, conjunctivae, lacrimal apparatus and extraocular muscles. The eyeball has three distinct layers; the fibrous tunic, the vascular tunic, the nerve tunic (light sensitive retina). The retina which is the inner part of the eye contains two major types of light-sensitive photoreceptor cells used for vision: the rods and the cones. They respond to light by transmitting a signal that triggers a cascade of biochemical reactions. These types of cells are known as photoreceptor cells. This culminates in the transmission of the signal to the brain, which perceives it as a vision [2].
Cone receptors contain cone opsins and respond to photons of different wavelengths, thus providing a basis for the colorful vision [3]. However, the rods are responsible for low-light (scotopic) monochrome (black-and-white) vision. Rods are distributed throughout the retina,but there are none at the fovea and none at the blind spot. Rod density is greater in the peripheral retina than in the central retina. They work well in dim light, because they contain a pigment, rhodopsin (visual purple), which is sensitive at low light intensity. Rhodopsin is also known as visual purple because it absorbs green-blue light most strongly and appears purplish in color. It is a light- sensitive pigment in outer part of rod [4]. Rhodopsin is a highly specialized G protein-coupled receptor (GPCR) which detects photons in the rod outer segment photoreceptor cells of the retina and mediates the sense of vision as a membrane protein. GPCRs are of special importance,because they form one of the largest and the most diverse groups of receptor proteins [5,6].
Evolutionary adaptation to differing environments has affected the selection of pigment isoforms, the level of pigment expression, the number of photoreceptor cell types, and the spatial organization of photoreceptors [7]. While Retinas of domestic mammals contain mostly rods, the retinas of domestic birds contain cones [2]. The number and ratio of rods to cones varies among species, depends on whether an animal is primarily diurnal or nocturnal [8]. For example, the owls have a tremendous number of rods in their retina [9].
The outer segments of rod and cone photoreceptor cells have important biochemical roles for phototransduction. Rhodopsins located in ROS initiate phototransduction with the effect of absorbed photons, and then it culminates in the closure of cyclic guanosine monophosphate–depends on channels located in the plasma membrane [10]. Changes in the structure of the ROS and the detailed morphological information obtained from the native ROS, particularly from different mammalians, are important to understand mechanisms underlying phototransduction and retinal dystrophies. The models including micro-nano and molecular scale structural details of retinal dystrophies can provide a method for testing various genetic and pharmacological therapies to combat diseases leading to blindness [11].
Quantitative considerations on retina, rhodopsin macromolecules and their three-dimensional morphological analyses are taking much interest during last ten years. Especially modern experimental techniques and their informative consultations are causing better understanding of retina rod and cone structure and its biochemical properties [10-15]. Distances among the various membrane components, the proper distance between adjacent discs and distributions of rhodopsins are very important and deterministic for phototransduction.
Mice are a small mammal belonging to the order of rodents. They are also nocturnal mammalian. Although constriction of rods was studied, the nanoscale structural characterization of rhodopsin in their natural environment has not been investigated by X-ray scattering methods. Thus, this study aims to quantitatively characterize nanoscopic ROS and rhodopsin structures of mouses by using X-ray scattering methods.
Until the present research, structural characterizations of macromolecular content of ROS samples were limited by imaging techniques such as transmission electron microscopy (TEM), scanning electron microscopy (SEM) and tomographic techniques [16].
In this work SAXS and WAXS analysis were carried out for the focused biological samples.
2.1. Animal and tissue preparation
For present study ten BL/6j mice weighing 35-45 g C57 were used. The mice purchased from the animal house of Cukurova University at Adana, Turkey. The colony was maintained under temperature (20 ± 1°C), relative humidity (50–80%), and illumination (12 h light,12 h dark) controlled conditions room. The animals were nourished standard mouse feed (procured by Feeding Company, Tavas Ltd., Turkey),and ad libitum water. The mice were anesthetized by intramuscular injection of 5% ketamine chlorhydrate solution (Ketalar, Parke-Davis) 0.85 ml/kg and 2% tiazine chlorhydrate solution (Rompun, Bayer) 0.35 ml/kg. The eyeballs were enucleated immediately under deep anesthesia and immersed in a 10% formaldehyde solution buffered with phosphate buffer (pH 7.4) for fixation. Retina whole mounts were prepared according to procedure described by Curcio et al (1987) [17].
The retina segments obtained from 10 Mice-664 C57BL/6J eyeballs (Figure .1) were surgically prepared and four of them which possibly have good ROS content were selected for Small/Wide Angle X-Ray Scattering measurements. All biological samples were removed from the eyes and gently shaken in the small volumes of formaldehyde (CH2O) to fix the biomolecular content.
“The macroscopic views of the samples were also illustrated in Figure .2 before placing them in the sample holder. All SAXS and WAXS measurements were completed for four samples and the best evaluation results were presented.
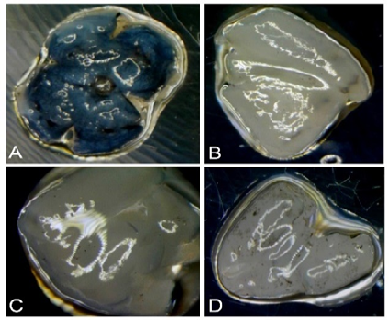
Figure 1. Dissection of an eye ball (A) and three retinas (B, C, D) which were obtained from mices
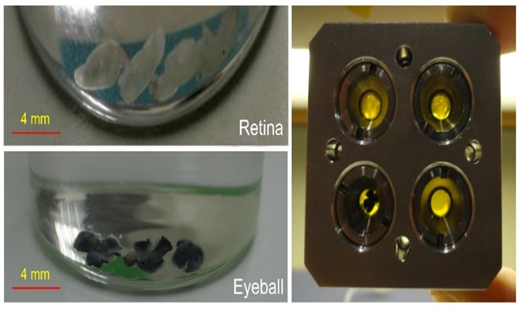
Figure 2. General views of mice eye balls (left down) and retina samples (left up) and the mounted samples in the sample holders before X-ray scattering measurements.
2.2. X-Ray Techniques
X-ray scattering experiments of the samples were made at beamline 23A1 IASW- NSRRC synchrotron radiation facility (Hsinchu, Taiwan) [5]. Each retina and eyeball samples were sandwiched between two capton film sheets and sealed to avoid evaporation. The gap between two capton films was 1.5-1.9 mm and the X-ray exposure time was 100 seconds for each sample. The scale factor (499.67and 727.38), sample transmissions (0.80 - 0.78), sample-detector distances (3433.801 mm and 3311.616 mm ) were determined for 10 and 15 keV energies respectively. The two different X-ray energies were used to see the energy effects on the nanoscale structures of the biological samples. The X-ray beam was passed through a 0.5 mm pinhole to create a microbeam on the samples. The Bragg spacing was calibrated with powder diffraction from silver behenate (orders of the 001 reflection at 1/5.838 nm-1). The X-ray detector was an image intensifier with a beryllium window (V5445P, Hamamatsu Photonics, Hamamatsu, Japan) coupled to a cooled CCD camera (ORCA-II-ER, Hamamatsu Photonics). The pixel size was _0.13 mm _ 0.13 mm, the X-ray flux was _5 _1011 counts s_1 and the beam size at the detector was _0.1 mm. A fast X-ray shutter that worked in milliseconds was used to avoid unnecessary radiation on the sample. On the X-ray camera the sample was observed with a microscope and retina sample was located and X-ray scattering patterns were recorded. The experiment was performed at the room temperature (300 K) with energies of 10 and 15 keV to reach wide q range data and the optimized and combined 2D and 1D data profiles of retina and eyeball samples were represented in Figure 3.
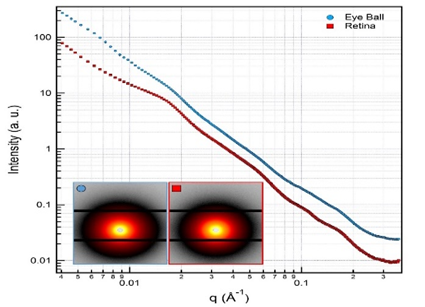
Figure 3. 2D-SAXS patterns and 1D-SAXS profile of the best samples. The colour scale represents the log of the scattering intensity as recorded by the CCD. Yellow represents the main scattered peak intensity and red represents higher intensity respect to dark scattering traces.
According to the qualitative comparison of the illustrated data, it may be said that nanostructured content have more effective and more distinguishable contribution to the data in the profiles of retina respect to that of eyeball. The more recordable and clear humps in Figure .3 are evidences of these nanoscopic structural contents. Figure .4 is also including 1D and 2D- WAXS patterns which have molecular scope structural information.
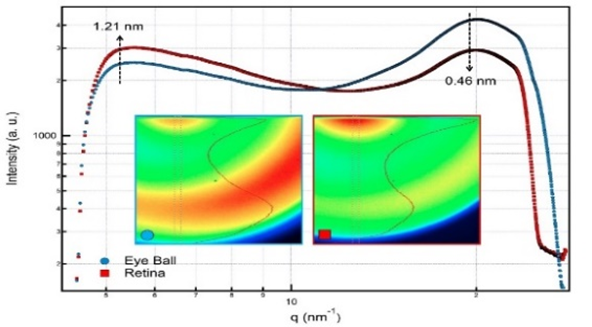
Figure 4. WAXS profiles of the two samples
WAXS profiles have also more intense scattering peaks for the more recordable and the bigger interplanar distances of retina sample. Eyeball sample has more different and rich molecular content. Because of this expected result, arbitrarily scattering effects in big q range for eyeball were recorded with more intense wide peak around q= 20 nm-1 in the WAXS profile.
In this study, nano scale 3D folding of rhodopsin in mice retinas and their native states were the first case quantitatively carried out by using small
and wide angle X-ray scattering (SAXS/WAXS) analyses. All geometrical parameters about 3D shapes of the nano structured aggregations were determined with Moore’s Indirect Fourier analyses [18], PDDs and electron density calculations. Presence of the other macromolecules in the structural content of retina can cause small angle X-ray scattering, too. So, the determined PDDs (Figure .5) of the best mice retina sample is very informative for ordered nanostructural contents such as ROS and rhodopsin which have membranous discs and approximately parallel ordered seven trans membrane a-helices.
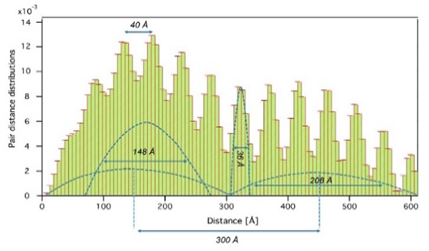
Figure 5. The quantitative detection of different shaped and sized nano aggregations by using the illustrated PDDs.
The significant correlation between PDDs evaluations and structural model of ROS can be explained by Figure .6 All structural parameters defined by disc diameter, the mean distance between discs, intra-disc space, thickness of membrane bilayer and rhodopsin size can be measured by PDDs analyses as seen in Figure .5 and 6.
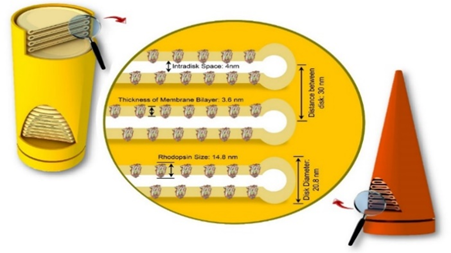
Figure 6. The measured nanoscopic structural content of ROS in retina
When the X-ray beam scattered from retina samples (in transmission mode), strong well-oriented histogram peaks were observed in PDDs as evidence of lamellar aggregations related with the neighbouring disk membranes in ROS. This lamellar stacking, with a periodicity of 30.0 nm (300 Å), originates in a linear arrangement of disk membranes in the outer segment of retinal rod. The similar observations have been also recorded in the previous published studies for isolated mouse eyeballs (30.4 nm) and the frog eye retinal rod (29.3 nm) [19]. The other determined and measured structural parameters can also be given as, the total length of seven membrane alpha helices = 252 Å, the thickness of membrane disc= 208 Å, the mean rhodopsin size = 148 Å, the distance of intermembranes 40 Å and the thickness of membrane bilayer = 36 Å.
The observed two humps in WAXS profile (Figure .4) with the interplanar distances of d1=1.21 nm (d1=2p/q1) and d2=0.46 nm are probably indicating distance between helical alpha transmembranes and the distance between methyl groups in retinals, respectively. These structural parameters may be seen in Figure .7 and the related values are in agreement with the previously determined results [20, 21] ,but these results must be confirmed by WAXS analyses on the isolated rhodopsin macromolecules which is a part of our next planned research program. Because macromolecular content of the focused biological samples are very rich,and small molecular contributions to the scattering data must be more recordable with more intense peaks which are appeared in WAXS range.
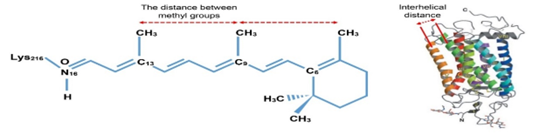
Figure 7. Visualisations of the possible distances obtained by using WAXS data
At the end of the study we may summarize the obtained results as follows,
-the distance of inter membranes is 83.3 Å,
-the thickness of membrane bilayers is 68.4 Å,
-Inter helical distance between alpha-helices trans membranes is possibly 12.5 Å,
-Internal distance between methyl groups is possibly 4.5 Å in retinal.
In the next step of the present study, ROS of retina samples will be solved by using convenient solvent/solvents to purify rhodopsin and to reach the number information of these macromolecules in ROS of the focused retinas. On the other hand, the light effect on rhodopsin structure may also be investigated and light illumination induced structural changes on retina may be examined with SAXS. When the eyes were illuminated with intense light through cornea, the lamellar spacing will be big probably decreased by 0.5-1.1% over 6 sec. This spacing change will be considered to be caused by blockage of dark current through the cellular membrane of rod by illumination. It causes shortening of the outer segment by a few hundred nm. Distinct intensity changes were observed in the lamellar diffraction with a time course similar to that of the spacing. Contrary to the previous reports at lower time resolution, change in the electron density profile of disk membranes was very small and the intensity changes may be mostly due to the spacing change.
Briefly it may be said that as general conclusion, this work provides an attractive strategy for the nanoscopic detection of ROS and rodopsin macromolecules. The different illness-treatment and physical- chemical effects on the retina may be followed in nanometric scale by using X-Ray scattering methods.
One of authors (Prof. Semra İde) would like to thank YÖK, NSRRC and Hacettepe University for the financial grand and the official permissions (respectively) during a scientific research programme at NSRRC, Taiwan.
Dear Editorial Team, Clinical Medical Reviews and Reports. My experience with the journal was highly positive. The peer-review process was rigorous, constructive, and completed in a timely manner. The reviewers provided valuable comments that helped improve the quality and clarity of our manuscript. The editorial office was professional, responsive, and supportive throughout all stages of the publication process. Communication was clear and efficient, and any questions were addressed promptly. Overall, I found the journal to maintain high scientific standards and an excellent publication workflow. I would be pleased to consider submitting future work to this journal. Best wishes from, Elena Popa.

It was my pleasure to submit my testimonial concerning the Reviewer Board of our Scientific Journal “Brain and Neurological Disorders”. The Reviewers focused on some modifications and their contribution was helpful. The ladies of our Editorial Office were also supported my efforts. It was my honor to have such a co-operation and I am looking forward for more collaboration.

Dear Grace Pierce, Editorial Coordinator of Journal of Clinical Research and Reports, Thank you for the speedy and efficient peer review process. I appreciate the fact that your peer reviewers do not take months to respond like with some other journals. I would also like to thank the editorial office for responding quickly to my questions. It is an excellent journal. I plan to submit more manuscripts in the future. Best wishes from, Robert W. McGee

Dear Grace Pierce, Editorial Coordinator of Journal of Clinical Research and Reports, Working with you and your team on our recent publication in JCRR has been a truly wonderful and enjoyable experience. The responses were prompt, and the reviewers were patient, constructive, and highly professional. One reviewer in particular gave me the feeling that a professor was carefully reading and commenting on my coursework, which was deeply touching. The entire process was straightforward and hassle‑free, with no tedious online forms to complete. I highly recommend this journal. Best wishes from, DR Aibing Rao, Head of R&D

I Appreciate the Opportunity to Share my Experience with the Journal of Clinical Research and Reports. The peer review process was timely and constructive, and the feedback provided helped improve the quality of our manuscript. The editorial office was professional, responsive, and supportive throughout the process, ensuring smooth communication and efficient handling of the submission. Overall, it was a positive experience collaborating with your team.

Dear Mercy Grace, Editorial Coordinator of Obstetrics Gynecology and Reproductive Sciences, We would like to express our gratitude for your help at all stages of publishing and editing the article. The editors of the magazine answer all the necessary questions and help at every stage. We will definitely continue to cooperate and publish other works in the Obstetrics Gynecology and Reproductive Sciences! Best wishes from, Alla Konstantinovna Politova,
