
Research Article | DOI: https://doi.org/10.31579/2692-9406/035
*Corresponding Author: Ahmed N. Ghanem, MD (Urology), FRCS Ed, Mansoura University, Faculty of Medicine, Egypt, Retired Consultant Urologist Surgeon & Independent Investigator No1 President Mubarak Street, Mansoura 35511, Egypt.
Citation: Ahmed N. Ghanem. (2021) Final proof Starling’s law wrong and G tube hydrodynamic is the correct replacement: New results and critical analytical criticisms of landmark articles. Biomedical Research and Clinical Reviews. 3(2); DOI: 10.31579/2692-9406/035
Copyright: © 2021 Ahmed N. Ghanem, This is an open-access article distributed under the terms of the Creative Commons Attribution License, which permits unrestricted use, distribution, and reproduction in any medium, provided the original author and source are credited.
Received: 23 November 2020 | Accepted: 19 January 2021 | Published: 22 January 2021
Keywords: capillary physiology; capillary interstitial fluid transfer; starling’s law; hydrodynamic ; hemodynamic; g tube; poiseuille’s tube and law; bernoulli’s equation
Substantial evidence demonstrating Starling’s law is wrong currently exists. This article presents the final definitive proof that Starling’s law is wrong, and the correct replacement is the hydrodynamic of the G tube. The presented evidence is based on reported and new results of the G tube hydrodynamic and critical analytical criticism of landmark and contemporary impactful articles. The objectives of this article are to affirm applicability to capillary; crossing the editors’ barrier to convince the hardest of critics that the new theory is correct. The new results presented here further affirm this and the critical analytical criticisms reveal many errors that has misled authors into reporting erroneous results and conclusions affirming Starling’s law and its equations are wrong. The new results show the difference between the hydrostatic pressure and the two components of dynamic pressure: Flow and Side pressures. The side pressure is a negative pressure gradient exerted on the wall of G tube built on a scale to capillary ultrastructure of precapillary sphincter and the wide intercellular cleft pores in its wall. This affirms Starling’s law and its equation are wrong and its correct replacement is the magnetic field like phenomenon of the G tube that explain the fast capillary interstitial fluid transfer necessary for viability of cells at rest and during strenuous exercise.
This article reports new porous orifice (G) tube results based on new insights, re-analysis, and interpretation of previously reported results. It also addresses issues that critically and analytically criticize landmark articles and two impactful recently reported articles on the wrong Starling’s law [1, 2]. The first article is an account on: “Mathematical model to determine the effect of a sub-glycocalyx space” that aimed to prove the Revised Staring Principle (RSP) as paradigm for reviving Starling’s hypothesis. My article here demonstrates that this is a futile attempt. The second article [2] that alsdefends Starling’s hypothesis by highlighting the role of precapillary sphincter in regulating blood flow, speed, and pressure of the capillary to the cerebral cortex in rats, in which it is wrongly concluded it maintains cerebral tissue “perfusion” in the title.
It is demonstrated here that the derived calculations are based on wrong formulae producing wrong results, graphs, and conclusions in article [2]. The authors are not at fault, but they were misled by wrong hypothesis and inadequate law and formulae. The 3rd and 4th articles are in persistent support of RSP. Professor Hahn has recently criticized RSP in an article titled: “The Extended “Revised” Starling principle needs clinical validation.” I have put my mark on this debate by reporting an article titled: “Revised Starling’s Principle (RSP): a misnomer as Starling’s law is proved wrong.” [6]. I agree with Hahn et al, but I think that their call for further clinical validation of RSP is unnecessary. I predict and warn authors that further clinical validation of RSP or any related research will prove to be total waste of energy, money, efforts, and time.
I had previously reported 21 reasons [7] affirming Starling’s law on the capillary-interstitial fluid (ISF) transfer wrong and the correct replacement is the hydrodynamic of G tube [8-11]. All the 21 reasons, plus more added here later, cannot be denied or refuted. Before that of course I had reported the physics study on the G tube as preliminary report at Medical Hypothesis in 2001 [8], emphasized 2017 [9] and the physiological evidence was reported also in 2017 [10] and concluded a plenary evidence reported in 2020 [11], titled: “The Correct Replacement for the Wrong Starling’s law is the Hydrodynamic of the Porous Orifice (G) Tube: The Complete Physics and Physiological Evidence with Clinical Relevance and Significance”.
This intellectually and experimentally based theory on the hydrodynamic of the G tube as replacement for the wrong Starling’s law is probably the most solidly concrete, thoroughly convincing, conclusive, extraordinarily impeccable, and theoretically provable discovery of all time that provides an overwhelmingly clear manifestation of the scientific physics, physiological and medical truth.
To clear any misunderstanding, I find discussing the following issues necessary. A “best critic” of mine, I wish I can call him a friend, brought this recently reported article [1] to my attention but refused to have his name mentioned or acknowledged. He also sent me this article published recently in Nature Communication [2]. When I sent him a copy of my Latter to Editor (LTE) of Nature Communications, he replied by email saying: “As an experienced manuscript reviewer, allow me to explain that your letter is immediately unacceptable to a reputable journal because your tone is in places over-effusive and patronizing, and in others insulting. It shows total disregard to the Journal's Instructions for Authors.” The text of this LTE is reproduced as part of section 7 of the discussion in this article. I immediately wrote back to him and apologized for sounding like that; explaining that I have never intended or wanted my tone in writing or saying to be over-effusive, patronizing, or insulting. I always read and follow the journal’s instructions for authors. I invited him to demonstrate his criticisms and suggest alternatives that I shall implement in all future writing, He has not replied.
I also wanted to say that: “My only interest is to propagate the bare scientific truth based on the results of sound experimental research work with total disregard to politics.” I am in the business of science and medicine not politics. If reporting the truth sounds insulting to someone that is tough as he/she will not get an apology for that. What makes my writing sound hierarchical and authoritative is the power bestowed on me while presenting and defending the scientific truth. Personally, however, I am most sincere, polite, easy going person and flexible in life who is easy to convince with the truth but powerfully rejects what is untrue or false.
Despite being patient for over 39 years trying to cross the firewall and the locked shut gates of two top journals among many, now at my age of 70 years old with little time left in life, I have become a little impatient! I have zero tolerance for scam, nonsense, and stupidity. Stupidity may inflict intellectual’s highly educated people who are plagued with wrong fixed idea making them so stubborn that prevent them from reasoning, comprehending and understanding, Arguing with them is a total waste of time, and I have no time to waste so I have no time for them. I cannot bear the deadly silence of peers, authors, and editors. I can handle editors’ rejection and peer reviewers’ criticism and respond to it if allowed. I have my own stupidity spot; I have acted stupidly when I refuse the repeated advice of my doctor, family members and friends to diet and stop or reduce smoking. I cannot do that as my brain functions only on glucose and nicotine, and I cannot deprive it of neither. I know I am killing myself feeding my brain with 2 packets of cigarettes per 24 hours, and my chest testifies for it as I can hardly breath without 3 inhalers.
Another anonymous good critic of mine justifiably wrote the best email/letter that is also the hardest critical criticism I have ever received in my entire life. It sets the standard for critical peer reviewing criticism (Please see the reviewer’s comments and author’s reply in SI 1) [DOI and URL at figshare] Digital Object Identifier 10.6084/m9.figshare.13213433 https://figshare.com/articles/journal_contribution/1_Supplementary_Information_on_Final_proof_docx/13213433].
The anonymous reviewer wrote on a previous article of mine that was rejected by an anonymous editor: “You are repeating and over-referencing yourself”. I agree; guilty as charged but I am not being unfair to any author. Both criticisms are correct as demonstrated in this article. Repetition is done for only one reason: absolute clarity and understanding for the reader’s benefit. As regards self-referencing, what can I do when there are no alternative references to use on the discussed issue except mine? There is nobody else in the whole world who reported on issues that is self-referenced here or in any other article of mine. The editors, peer reviewers and readers may challenge me on that by producing one reference that may replace any of mine, and I shall replace mine with it immediately.
Also, there seems that nobody is taking notice of what I report or say and the whole Scientific and Medical World seem to be not just asleep but in a state of deep coma [12]. The whole Medical, Scientific, and official Government Worlds have remained occupied with Covid-19 for nearly a year now and shall remain occupied with it for an unknown period yet to come. Research on all other areas of medicine have taken a second priority, but I have not neglected my research. I have been working on many research articles including this one improving and editing it in solo isolation. Another reason is that all my reported research articles of > 65 over the last 4 years only are not referenced in PubMed because it all was reported in Open Access Journals but are there in Google Scholar and probably other search engines. I must keep knocking on the locked gates until the Scientific and Medical World wake up and open the locked shut gates for me.
Thanks to constructive criticisms of my anonymous peer reviewer on previous article of mine, after editing answering to all and every raised issue, it became ridiculously too long. I had to split it and ended up with 2 accepted and reported articles [13, 14] instead of one. Both articles are new, original, and important landmark articles on the patho-aetiology and therapy of the acute respiratory distress syndrome (ARDS). Demonstrating ARDS link with the transurethral resection of the prostate (TURP) syndrome and how both are induced by volumetric overload shocks (VOS) precipitated by the wrong starling’s law dictating the faulty rules on fluid therapy. In all cases of ARDS presenting with the TURP syndrome or acute kidney injury (AKI) it originally presents with cardiovascular shocks of VOS and later with all the manifestations of the multiple organ dysfunction syndrome (MODS) [13, 14].
The primary endpoint objective of this article is to provide substantial, solid, unquestionable, and convincing plenary evidence for the theory that the G tube phenomenon as the correct replacement for the wrong Starling’s law. The secondary endpoint objective is to cross the firewall and open the closed shut gates to reputable top journal to report this article by convincing its editors and peer reviewers of the validity, correctness and worthiness of the G tube theory presented her.
There is also a deeper important objective for reporting this final article. I am certain it will help to save hundreds of thousands of ARDS patients’ lives who die all over the World every year [13, 14]. The wrong Starling’s law is the real culprit inducing VOS [15, 16] that cause ARDS [13, 14]. This will satisfactorily fulfil my pledge to the 3 patients I witnessed being killed by a condition known in urology as the TURP syndrome [17] as example of VOS1. This was back in 1981 at the Urology Department, District General Hospital, Eastbourne, UK where I was working as Senior House Officer.
The TURP syndrome is induced by sodium-free fluid overload or volumetric overload type 1 (VO1) characterized with acute dilution hyponatraemia [17]. It has similar clinical picture to ARDS of MODS, though coma of hyponatraemia predominates in the TURP syndrome. VOS are of 2 types: VOS1 and VOS2. The TURP syndrome is an example of VOS1. As for VOS2 it is induced by volumetric overload of sodium-based fluids type 2 presenting in theatres with shock or cardiopulmonary arrest. VOS2 has no clear markers like hyponatraemia of VOS1. Both types of VOS cause ARDS that complicate fluid therapy but are unrecognized and underestimated. Starling’s law misleads treating physicians into giving too much fluid for the resuscitation of shock, acutely ill patients and patients undergoing prolonged major surgery inducing VOS that cause ARDS [13, 14]. This explains how and why these major investigations started 39 years ago at the at multiple fronts of Physics, Physiology and Clinical Medicine.
The following issues on critical analytical criticism of landmark articles on Starling’s law supported by the reported results and the new results and insightful interpretations of the presented G tube experiments shall be presented and discussed under the following sections: -
Section 1 on the current engineering microvascular and capillary ultrastructure anatomy, and correct physiology on pressure and red blood cells (RBCs) speed or capillary blood speed (CBS).
Section 2 shall give brief perspective account on landmark articles on the history of Starling’s hypothesis on capillary interstitial fluid (ISF) transfer, and its transformation into a law.
Section 3 shall give a summary of the new insights and discoveries on the hydrodynamics of the G tube reported here.
Section 4 presents the physics and physiological relevance of the hydrodynamic of the G Tube to the hemodynamic of the capillary specifically Starling’s law on the capillary-ISF transfer.
Section 5 shall analyze the report by Landis the great physiologist in the light of the new insights and discoveries on the hydrodynamic pressures of the G tube as compared to hydrostatic pressure.
Section 6 shall criticize the report by Pappenheimer and Soto-Rivera on investigating the capillary hydrostatic pressure. This is the report after which Starling’s hypothesis was transferred into a law with equations. A serious experimental error by the authors is identified and reported.
Section 7 shall demonstrate how this current impactful article [2] was criticized objecting to the word “perfusion” in the title and recommending a correction of serious errors in results, graphs and conclusions highlighted by the use of the word “perfusion” in title that supports Staling’s law.
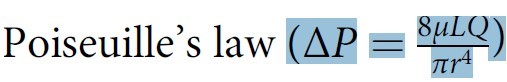
Section 8 criticizes Poiseuille’s law and Bernoulli’s equation’s applicability to the hydrodynamics of the G tube and hemodynamic of the capillary. These law and equation certainly have proved great in aerodynamic and hydrodynamic but have not helped physicians to practice precision medicine by being inapplicable to the hydrodynamic of the G tube and the hemodynamic of the capillary.
Section 9 shall demonstrate how to criticise the current article of most concern [1] that provide Mathematical Proof on the Revised Starling Principle (RSP) that supports Staling’s law. Here it is demonstrated that RSP is neither correct nor required and the reported complex mathematical equations whether correct or wrong do not apply and are too complicated, unnecessary, and unrequired.
Section 10 shall criticise the G tube theory answering the accusation of inapplicability of the hydrodynamic of the G tube’s phenomenon to the capillary hemodynamic further affirming it is the correct replacement for Starling’s law.
Section 11 demonstrates the red blood cells (RBCs) speed or capillary blood speed (CBS) is not “very slow” as generally believed but rather fast as it has a fast speed at start in the pre-capillary sphincter that extends as fluid jet with descending gradient along the wider lumen tube: it ejects from the precapillary sphincter into capillary as it does from the orifice to the wide lumen of the G tube.
Section 12 is on correcting the received error that the cross-section area of all the capillaries is very much greater than the aorta based on which a formula wrongly produces “very slow and fixed speed” of RBCs speed or CBS in the functional capillary. This correction is based on the G tube’s newly presented results showing fluid flow (akin to CBS) is fast with a dynamic descending gradient of velocity along the length of the wide section of the tube (G tube and capillary) (Figure 5).
Section 13 is on missing data from precision engineering microvascular and capillary ultrastructure anatomy, and correct physiology on pressure and RBCs speed or CBS and suggestions for future research.
Section 14 is a brief statement testifying that the authors of articles [1] and [2] have not done anything wrong. They were only misled by the many errors and misconceptions gathered over the decades that produced wrong law and formulae which produce wrong results and conclusions in article [2] or new wrong formulae for calculating flux across the capillary wall and subendothelial glycocalyx space of doubtful existence as reported by the authors [1]. My humble condolence sincere commiserating apology is offered to the authors for wasting a career life defending the flatly wrong and indefensible Starling’s law and RSP.
Section 15 is a sincere cordial invitation to all authors in support of Starling’s hypothesis and RSP to do the calm and moral act of accepting and approving the theory on hydrodynamics of the G tube as the correct replacement for the wrong Starling’s law and attempt to discover the equations for it with a possibility of winning a consolation Noble’s prize.
Section 16 aims to express being in big financial and gratitude debt to all Open Access Journals’ Editors for accepting and reporting all my 65 articles free of article processing charges (APCs). Thanks also must go to peer reviewers. I can assure all that all journals will get paid in due course paying only the acceptable affordable APC.
Section 17 is a CONCLUSION with an added invitation to the concerned scholars of the world: Acting like a politician for once in my entire life, may I ask all scholars of editors, peer reviewers and readers of this article, please, vote for me to be nominated for a Noble Prize for all my discoveries in Physics, Physiology and Medicine [12]- with this article being the crown of all my reported articles. That is one thing I cannot do myself as self-nomination for Noble Prize is not allowed.
Results
The purpose of reproducing part of this results section with a set of photographs is that it is mandatory for absolute clarity and understanding of the new results, discussion and conclusions reported here. This allows the reader to easily follow and comfortably understand the NEW G tube results, discussion and conclusions presented here. The reproduced results and photographs have been moved into the Supplementary Information (SI2) with (Figures 1-18) [DOI and URL at figshare] Digital Object Identifier 10.6084/m9.figshare.13213433 https://figshare.com/articles/journal_contribution/1_Supplementary_Information_on_Final_proof_docx/13213433]. For easy comfortable understanding, however, it is highly recommended that the reader should start with reading the results and viewing the figures in SI2 before proceeding with reading this new article results and discussion that follows here.
Hydrodynamic of the G tube
I investigated the hydrodynamics of the porous orifice (G) tube built on a scale to the capillary ultrastructure with its precapillary sphincter [18] and wide intercellular cleft pores [19] that allow the passage of plasma proteins. The hydrodynamics of Poiseuille’s tube were also investigated and contrasted to the hydrodynamics of the G tube.
The side pressure (SP) in Poiseuille’s tube exerted on its wall is an ll positive pressure gradient causing filtration all along the tube, maximum near the inlet and minimum near the exit as already well known (Figure 1) but reported here for comparison with G tube dynamics (Figure 2).
In contrast, the SP of the G tube creates negative side pressure gradient along the G tube that is maximum negative near the inlet and turns gradually positive to become maximum positive near the exit (Figure 2)

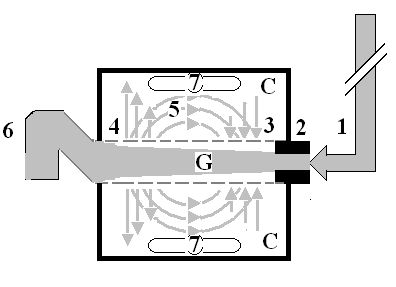
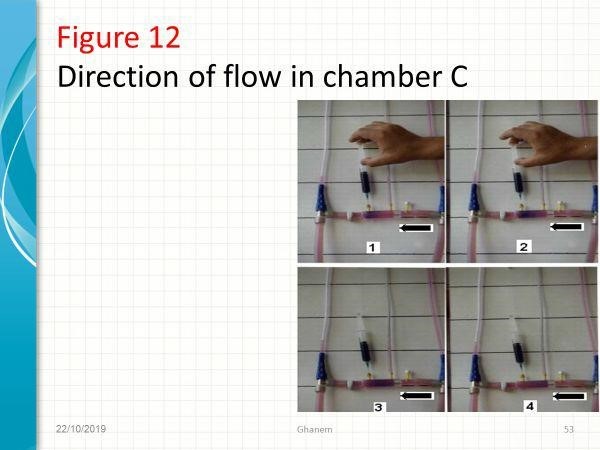
The numbers should read as follows:
The inflow pressure pushes fluid through the orifice
Creating fluid jet in the lumen of the G tube**.
The fluid jet creates negative side pressure gradient causing suction maximal over the proximal part of the G tube near the inlet that sucks fluid into lumen.
The side pressure gradient turns positive pushing fluid out of lumen over the distal part maximally near the outlet.
Thus, the fluid around G tube inside C moves in magnetic field-like circulation (5) taking an opposite direction to lumen flow of G tube.
The inflow pressure 1 and orifice 2 induce the negative side pressure creating the dynamic G-C circulation phenomenon that is rapid, autonomous, and efficient in moving fluid and particles out from the G tube lumen at 4, irrigating C at 5, then sucking it back again at 3,
Maintaining net negative energy pressure inside chamber C.
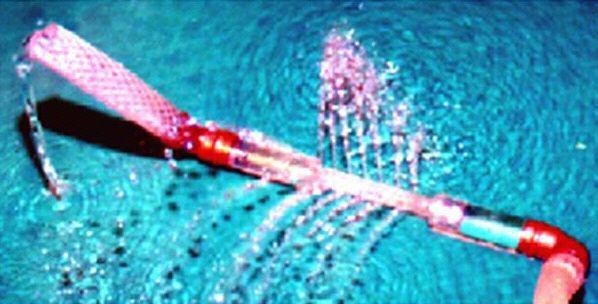
**Note the shape of the fluid jet inside the G tube (Cone shaped), having a diameter of the inlet on right hand side and the diameter of the exit at left hand side (G tube diameter). I lost the photo on which the fluid jet was drawn, using tea leaves of fine and coarse sizes that runs in the centre of G tube leaving the outer zone near the wall of G tube clear. This may explain the finding in real capillary of the protein-free (and erythrocyte-free) sub-endothelial zone in the Glycocalyx paradigm (Woodcock and Woodcock 2012) [3]. It was also noted that fine tea leaves exit the distal pores in small amount maintaining a higher concentration in the circulatory system than that in the C chamber- akin to plasma proteins.The negative SP of the G tube creates net negative pressure in the surrounding chamber (C) around the G tube (Figures 5-7), akin to the pressure in the interstitial fluid (ISF) space that is also negative of -7 cm water [20].
The direction of flow in chamber C is in the opposite direction to the flow inside the G tube and has a magnetic field-like pattern of flow (Figures 2, 5).
It is clear from the above that Starling did not know the following facts when he proposed his hypothesis for the capillary-ISF transfer and the formation of oedema at the Lancet in 1886 [21] and 10 years later at J Physiol. in 1896 [22]:
The hydrostatic pressure that is of a stagnant fluid is different from the dynamic pressure of fluid in motion. The lumen pressure of moving fluid inside any tube such as Poiseuille’s and G tube has 2 dynamic pressure components at any one point- unlike the hydrostatic pressure of a stagnant fluid which has only one value. The 2 dynamic pressure components are:
Flow pressure (FP) in the direction of flow that is high positive in both Poiseuille’s and G tubes and is responsible for the flow. FP has a descending gradient along the tube.
Side pressure (SP) exerted on the tube’s wall that is positive but lower than FP in Poiseuille’s tube**.
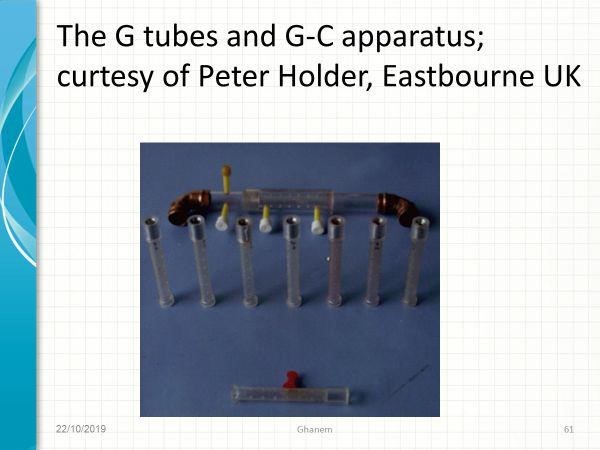
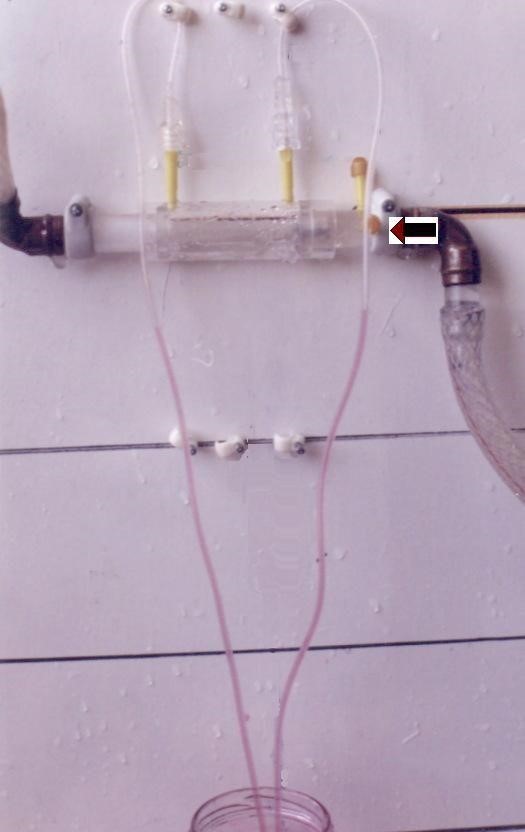
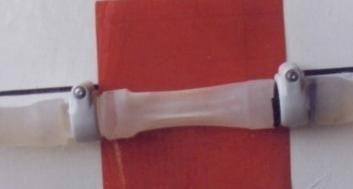
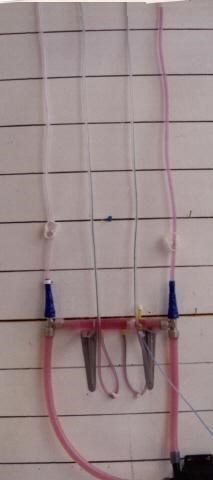
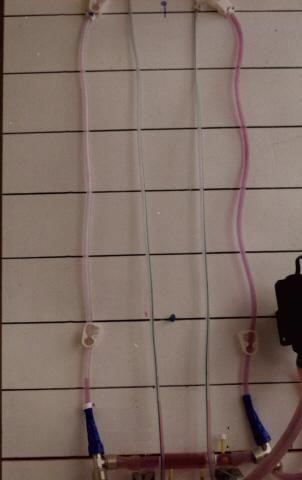
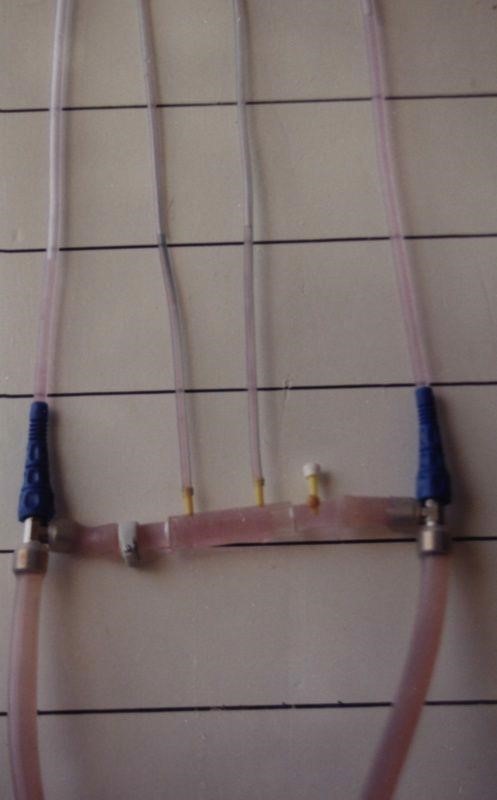
**This SP is negative pressure gradient in the G tube that is maximum negative near the inlet and turns positive maximum near the exit. A full set of G tubes and a G-C apparatus, curtesy of designer engineer Mr Peter Holder of Eastbourne UK, are shown in (Figure 3).
The negative SP of G tube is demonstrated in (Figures 4, 5). This SP creates net negative pressure in a chamber C surrounding the G tube as shown in (Figures 5-7).
Also, Starling when he proposed his hypothesis of fluid filtration by the hydrostatic pressure of the capillary and absorption by the oncotic pressure of plasma proteins did not know about the precapillary sphincter [18] and the wide pores of normal capillaries that is made of intercellular clefts [19] that allow the passage of plasma proteins- hence oncotic pressure does not exist in vivo. These capillary ultra-structures were discovered >80 years after Starling’s report. Both discoveries were reported in 1967 >80 YEARS after Starling’s hypothesis reported in 1886 and 1896 [21, 22]. The G tube was purposefully built on these ultra-structures of the capillary tube to investigate and contrast with Poiseuille’s tube. The investigations ware done and concluded during 1981-1983 at Eastbourne, in the U.K.
A full set of G tubes and a G-C apparatus, curtesy of designer engineer Mr Peter Holder of Eastbourne UK, are shown in (Figure 3).
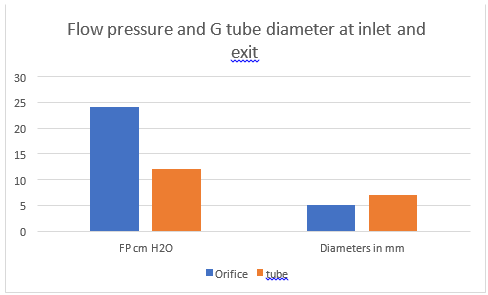
Factors which induce and affect SP and CP are the orifice diameter (Figures 8 and 9), the proximal pressure [PP] (Figure 10) and the distal pressure (DP) (Figure 11).
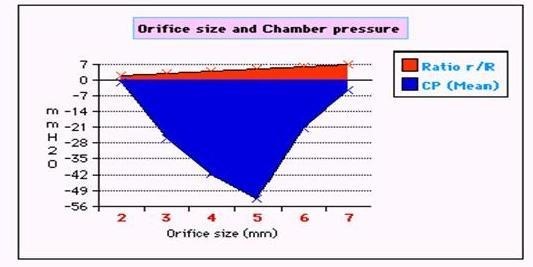
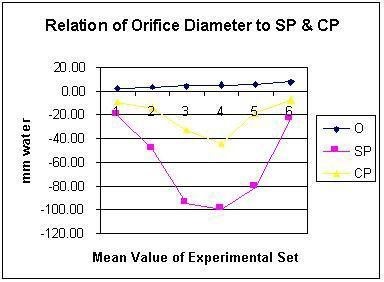


The relation of orifice diameter to SP and CP is an inverted bell-shaped (Figure 9) with maximum negativity at an orifice of 5 mm of the G tube’s diameter of 7 mm (i.e. a ratio of 0.7) that is the equivalent of 0.5 of cross section area when maximum suction occurs, and a most efficient and speedy G-C circulation operates.
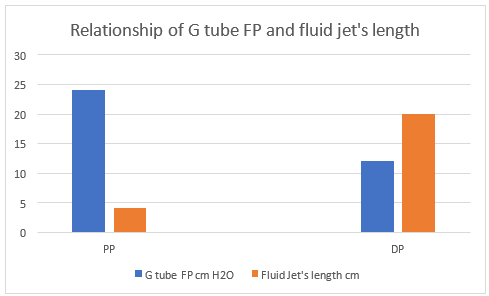
An increase in PP augments suction and increases the negativity of SP and CP and the speed and efficiency of the G-C circulation (Figure 10). Please note that the negative SP and CP occur at low PP as low as 24 cm water (Figure 10, 16). This pressure is lower than that of the capillary pressure measured by Landis [20] at the arterial end of the capillary of 32 mmHg.
An increase in DP increases volume in chamber C and reverted CP from negative to positive (Figure 11).
The increased volume in C is akin to ISF oedema formation. An increase in DP has similar effect to a drop or decrease in PP, not an increase. The direction of fluid flow in chamber C is in the opposite direction to flow inside the G tube (Figure 5, 12.)
The hydrodynamic of the G-C apparatus connected to a circulatory system is shown in (Figures 13,14) and contrasted to the circulatory hydrodynamic of Poiseuille’s tube (Figure 15).
Also elevating DP akin to elevated CVP augments oedema formation as does low PP akin to hypotension of the circulatory system.
A negative SP gradient of the G tube reflected on chamber C pressure causing net negative chamber pressure (CP) in C (Figures 5-7). The direction of fluid flow in chamber C is in the opposite direction to flow inside the G tube and circulatory model (Figure 12). The negative SP gradient of the G tube connected to a circulatory model (Figures 16). is the same as G tube isolated as shown in (Figure 2). It has maximum negative pressure near the inlet where suction or absorption occurs (Figure 4), and maximum positive pressure near the exit of the G tube where filtration occurs (Figure 2, 5, 16).
Adding tea leaves of fine size that crosses the wall holes of the G tube, and coarse size that does not, shows that both types of tea leaf particles are concentrated at the centre of the G tube’s jet in a G-C apparatus in circulatory model maintaining higher concentrations inside the circulatory system than in the surrounding chamber C (Figure 5). On passing through the G tube, the tea leaves concentrate inside the cone shaped fluid jet leaving a free zone lining the G tube’s wall mimicking the plasma protein molecules, platelets, and red blood cells (RBCs) speed in the capillaries of the cardiovascular circulatory system. Fine leaves enter chamber C in a small amount through holes near the distal end
of the G tube, governed only by fluid flow kinetics in the G tube as in the capillary. This is represented by the cone shaped fluid jet inside the G tube shown in the diagram in (Figure 5). This mimics the protein-free and erythrocytes-free layer zone next to the glycocalyx membrane that lines the capillary endothelium. Any excess fluid, big particles, and fat globules in the ISF space is off course drained by the lymphatics or manually cleaned up in the G-C apparatus.
It was also observed, though not measured, that the speed of tea leaves passing through the G tube is FASTER than that in the proximal tube of the circulatory system shown in (Figures 13, 14). Please keep that in mind on discussing the capillary blood speed (CBS) or the red blood cells (RBCs) speed in the capillary as compared to the aorta later.
In Poiseuille’s tube SP is positive all along the tube that is maximal near the inlet (proximal pressure is akin to arterial pressure) and lower near the exit that is distal pressure (akin to venous pressure) inducing net positive pressure inside the surrounding chamber C as shown in the middle two manometers in the middle of (Figure 15). The direction of flow in chamber C around Poiseuille’s tube is down the pressure gradient that is the same direction as fluid flow inside the tube and the circulatory system.
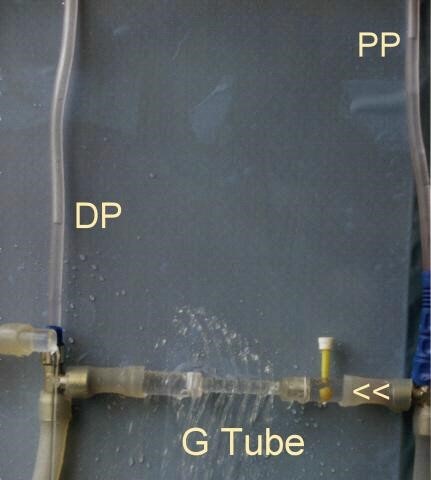
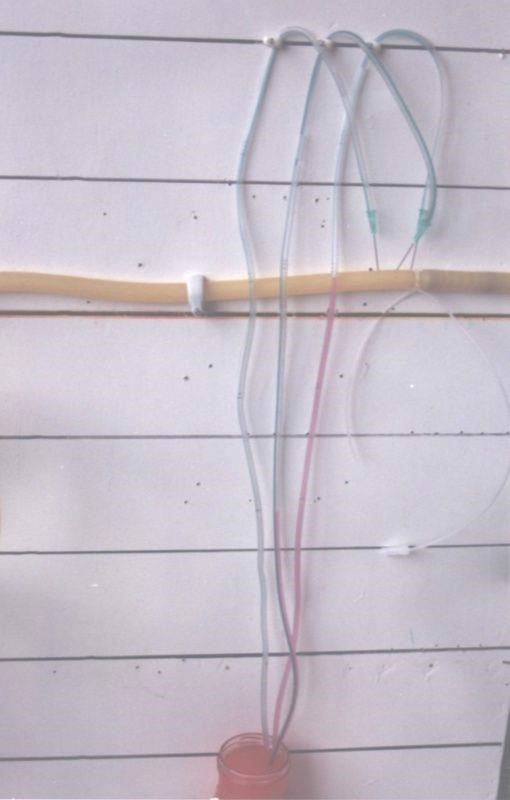
Connected to a garden hose. It shows lower PP of 24 cm water and DP of 12 cm water and the side pressure gradient higher positive maximum at exit. The negative SP near the inlet is not shown here but is demonstrated elsewhere (Figure 4,5). The pressure gradient also demonstrates the direction of flow in the G tube from right to left hand side. The system is continuously overfilled from a water hose to replace the water loss from the holes of the G tube. Please, note that the proximal and distal pressures before and after the G tube shows values of 24 and 12 cm water, respectively, that are lower than and equal to mean pressure at proximal and distal pressure obtained in a real capillary by Landis of 32 and 12 mmHg (see text) and still induce the G tube phenomenon as shown here and in (Figures 2, 5).
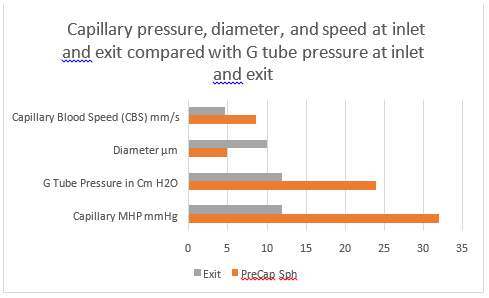
The dynamic FP and SP of both the G tube and Poiseuille’s tube were measured as shown in (Figure 17) and represented graphically in (Figure 18). These figures’ data affirm that the lumen pressure of a dynamic fluid has two pressure components inside both the G tube and Poiseuille’s tube: FP and SP. Measuring the FP in a tube by a cannula facing upstream that totally obstruct the tube’s lumen represent the high positive hydrostatic pressure, called the MEASURED hydrostatic pressure (MHP) similar to that measured by Landis at the arterial end of the capillary [23]. It represents FP but does not show SP at all. So, the measured hydrostatic pressure (MHP) does not show the negative SP at all neither in the G tube nor in Poiseuille’s tube. This is important for the coming discussion on defining and precising the meaning of P and ∆P used in the equations of Poiseuille’s law and Bernoulli’s equation.


An increase in PP augments suction and increases the negativity of SP and CP and the speed and efficiency of the G-C circulation (Figure 10).
An increase in DP increases volume in chamber C and reverted CP from negative to positive (Figure 11). The increased fluid volume in C is akin to ISF oedema formation. An increase in DP has similar effect to a drop or decrease in PP, not an increase. This is important issue based on which the report by Pappenheimer and Soto-Rivera [24] is criticized later. The direction of fluid flow in chamber C is in the opposite direction to flow inside the G tube (Figure 5,12). The G tube inside G-C apparatus in a circulatory model (Figure 16) acts the same as when isolated (Figure 2).

So the dynamic variables in an apparently impossible future equation or equations should include:-
The FP gradient for (FP and ∆FP) for which the measured hydrostatic pressure (MHP) may be used such as that measured by Landis at capillary inlet and exit (MHP-inlet and MHP-exit).
The SP gradient for (SP and ∆SP) as measured in the G tube (Figure 17,18)
The fluid jet diameter (Dj) at precapillary sphincter and at exit (Dj inlet and DJ Exit) (Figure 5).
The fluid jet length (Lj) (Figure 17) and tube length (L).
The CBS or RBCs speed at start and end of the capillary (CBS inlet and CBS exit) as suggested to be done in future at both arterial and venous ends of the capillary by Stucker et al [21].
However, as all the above dynamic variables are measurable the equation may be easier than one might think.
Further invaluable intelligence insights with re-analysis and interpretation of the results of the hydrodynamics of the G tube has resulted in revealing the following new results. (For Figures 1-18 please see SI2).
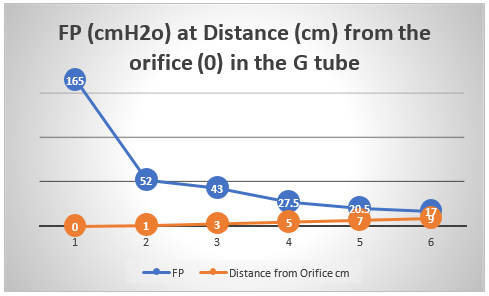
The measured hydrostatic pressure (MHP) measured by a cannula facing up stream and occluding the lumen of the wide section of the G tube, Poiseuille’s tube or capillary may represent flow pressure (FP) that is different from the single value MHP referred to as P in Poiseuille’s equation and ∆P derived from the equation. FP is a positive descending pressure gradient in the direction of flow along Poiseuille’s tube and the G tube (Figures 10, 17, 18 in SI2, 19-24) for FP and SP.
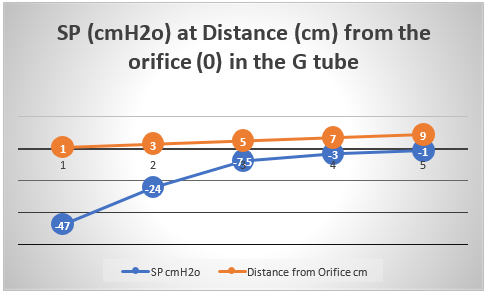
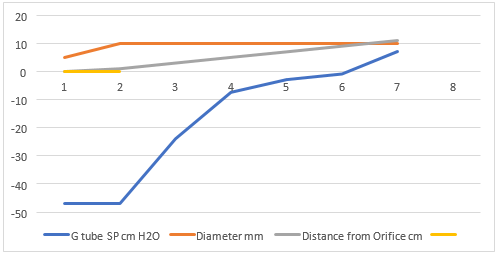
This MHP represent FP that is measurable in both Poiseuille’s tube and the G tube and has descending pressure gradient along the tube (Figures 17-19, 21, 22). The FP in relation to distance from the orifice of the G tube is shown in (Figures 19). The side pressure (SP) exerted on the wall of the G tube at distance from the orifice along the G tube is shown in (Figure 20, 23, 24).
ln the capillary MHP was measured by Landis [23] at the arterial and venous ends of the capillary which has values of 32 and 12 mmHg, respectively. This is the positive descending gradient of FP in the capillary as in the G tube showing proximal pressure (PP) at 7 cm before the G tube and distal pressure (DP) at 8 cm after the G tube exit inducing both FP and SP (Figures 19-24) based on the photograph in (Figure 16 in SI2) with a distance of 25 cm between the two readings of PP and DP. The G tube’s length is only 100 mm.
Both FP and SP are dynamic pressure gradients operating in the direction of fluid flow in the case of FP and in a perpendicular circular plane exerted on the tube’s wall in the case of SP.
The two dynamic pressure components of fluid flow in the wide section of G tube’s lumen of FP and SP and its gradients are not represented neither in Poiseuille’s law nor in Bernoulli’s equation.
The SP at the orifice of the G tube and at the pre-capillary sphincter is negative pressure known as Venturi’s effect (Figures 23, 24).
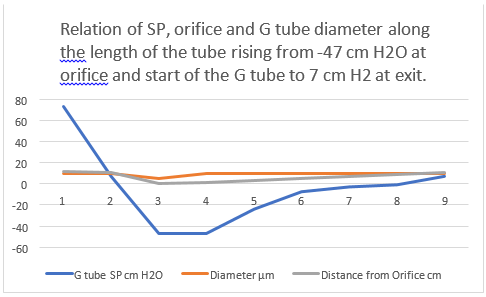
The SP in the wide section of the G tube has unique effect on its wall; negative pressure gradient maximum over the proximal part near the inlet and turns gradually along the tube into positive pressure gradient maximum over the distal end of the G tube (Figures 2, 5, 23, 24). So, a zero value is presumed to occur at the turning point from negative to positive pressure along the G tube, though this is hardly detectable in a circulatory system. The distal pressure (DP) under optimum diameter of 0.7 of the G tube’s diameter (5/7 mm) which gives optimum operating of the phenomenon of the G tube is demonstrated in the circulatory system later to be <7>
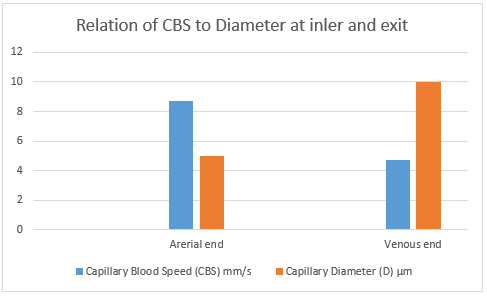
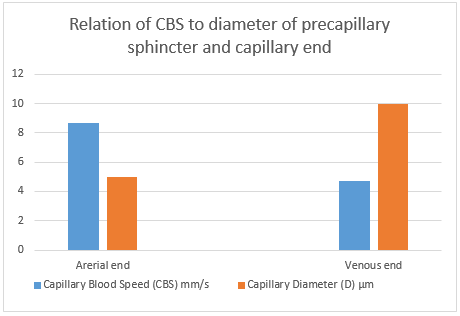
In the circulatory cardiovascular system, the zero pressure occur only at the right atrium which is known as the central venous pressure (CVP) with fluctuation of ±7 cm water. So, the speed of RBCs or CFS reported by calculation based on the given equation at the precapillary sphincter of (8.7 ± 0.6 mm/s) is the same at the start of the capillary and reduces at the distal end of the first order capillary to (4.7 ± 0.6 mm/s) [2]. This represents the RBCs speed or CBS descending speed gradient along the length of the capillary (Figures 25-27).
Some data on the dynamic pressures and RBCs speed or CBS gradients in the capillary are currently available as in the G tube. The FP and SP in the G tube are shown in (Figures 5, 17, 18 SI2) and in the new graphs (Figures 19-24).
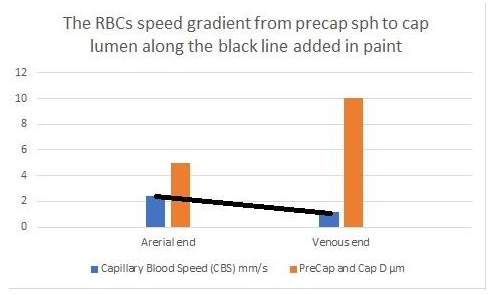
In order to predict the correct speed of RBCs or CBS a line connecting the speed at precapillary sphincter of 8.7 mm/s and that at the distal end of the capillary of 4.7 mm/s based on data from rats reported by Grubbs et al [2] and possibly in humans capillaries reported by Suckers et al [25] (after correction) as shown in (Figures 27, 28). From any point along the black line dropping a perpendicular line on the speed Y axis of the graph should give the exact RBCs speed at any point along the capillary length. To validate these data a study measuring RBCs speed or CBS at both the arterial and venous ends of the capillary in humans and/or rats is required taking care of measuring the capillary length at the same time. The RBCs speed or CBS gradient represented by the black line in (Figure 27, 28) is adequate for inducing the G tube phenomenon between the capillary and ISF space.
Data from the G tube on FP fits quite well with data from the capillary anatomy and physiology on the same graph (Figures 29). The capillary is the G tube, and the G tube is the capillary.
Based on the above results the dynamic variables in an apparently impossible future equation or equations should include:
The FP gradient for (FP and ∆FP) for which the measured hydrostatic pressure (MHP) may be used such as that measured by Landis at capillary inlet and exit (MHPinlet and MHPexit).
The SP gradient for (SP and ∆SP) as measured in the G tube (Figure 17, 18).
The dynamic fluid jet diameter (Dj) at precapillary sphincter (5 µm) and capillary lumen at exit (10 µm) (Dj inlet and DJ Exit) as shown in (Figure 5) is important for the accuracy of a new equation.
The fluid jet length (Lj) (Figure 17) and the G tube or capillary length (L) are noted.
The CBS or RBCs speed at inlet and exit of the capillary (CBSinlet and CBSexit) as done at distal end and suggested to be done in future at both arterial and venous ends of the capillary by Stucker et al [25] though their reported figure of 0.47 mm/s is probably incorrect (perhaps due to misplaced decimal point as it should read 4.7 mm/s?). However, the possibility that the decimal error was done by Grubb et al needs verification from both authors. If no errors are found, then perhaps it is a variation of capillary blood speed between species of humans and rats.
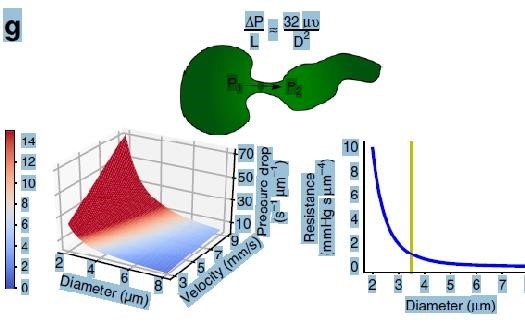
It should be noticed that the diameter (D) expressed in the equation above the (Fig. 2g) [2] shown here as (Figure 30), gives results that refer to a single static pressure value that is correct only at the sphincter and distal end of the capillary. In the entire wide section of the G tube and capillary, the diameter (D) of the wide section tube plays no role in the equation above (Fig.2g) (Figure 30). It should be replaced by the dynamic diameter of the fluid jet (Dj) from orifice of 5 µm to exit 10 µm of the capillary. In the G tube the orifice diameter is 5 mm and lumen diameter 7 mm.

The D that should represent the diameter of the wide section of the capillary bed is that in fact of the dynamic diameter of the fluid jet as shown along the lumen of the G tube’s length that equals D of the orifice and the diameter of the tube when the fluid jet touches the wall at the exit (Figure 5). This means that RBCs speed or CBS of 8.7 and 4.7 mm/s are correct at the precapillary sphincter with a diameter of 5 µm and at the distal end of the capillary only with a diameter of 10 µm (Figure 25-28). This may represent the end life of application of Poiseuille’s law in the G tube.
Over the wide section of the G tube and capillary bed neither Poiseuille’ law nor Bernoulli’s equation can predict the side pressure (SP) exerted on the wall of the precapillary sphincter nor the proximal part of the G tube at the capillary bed that has a negative value (Figure 23,24).
The results of the equation (Fig.2g) shown in (Figure 30) for calculating FP or MHP and speed of fluid jet is correct only at the orifice and at the distal end of the capillary but not for the intervening wide section of the G tube and capillary as the jet does not directly touch the wall of the wide section of the G tube at all (Figure 5, 26, 27). Meaning that the tube diameter (D) does not participate in the equation, but D here should be used to represent the changing dynamic diameter of the fluid jet inside the lumen of the G tube which changes from 5 to 7 mm or as ratio from 0.7 to 1 as the diameter of the orifice or capillary sphincter and G tube, respectively. This orifice/tube ratio is the equivalent of 0.5 cross section area of the G tube. In a circulatory model the fluid jet is separated from the tube’s wall by particle free layer lining the smooth glycocalyx layer that lines the endothelium wall. As all the above variables are measurable, the equation may be easier than it appeared initially.
Discussion
The above results demonstrate that the Poiseuille’s tube has a positive SP causing filtration all along its entire length which is maximum near the inlet and lower near the exit (Figure 1).
The side pressure in the G tube causes negative pressure gradient exerted on the wall that is maximum negative near the inlet (Figure 4, 5 SI) and turns positive pressure maximum near the exit (Figure 2 SI). Thus, absorption of fluid occurs through proximal holes maximum near the inlet and filtration occur through distal holes maximum near the exit of the G tube. This negative SP gradient of the G tube creates unique autonomous rapid magnetic field-like fluid circulation between fluid inside its lumen and that surrounding it in chamber C (Figure 2, 5 SI). The net pressure in a surrounding chamber C is also negative (Figure 5-7 SI). These findings have important serious implications of relevance to the capillary physiology [7-11] and high clinical significance [13-16] as summarized here.
The physiological relevance of the hydrodynamic of the G tube to normal capillary physiology.
The presented evidence demonstrates that the hydrodynamic of the G tube is totally different from Poiseuille’s tube. This is relevant to the physiological function of capillary regarding the capillary-ISF transfer currently attributed to Starling’s forces. When Starling proposed his hypothesis on the formation of oedema in 1886 and 1896 [21,22], he assumed that the capillary works as Poiseuille’s tube of uniform diameter and its hydrostatic pressure induced by the high arterial pressure is responsible for filtration of fluid higher over the proximal part of the capillary.
It was discovered >80 years later in 1967 that the capillary has a narrow orifice; the precapillary sphincter [18]. Hence the capillary is a G tube not Poiseuille’s tube. Starling also wrongly assumed that absorption of fluid is induced by the oncotic pressure of plasma proteins (albumin) as he thought that the capillary wall is impermeable to albumin. It was also discovered in 1967 that the capillary has wide pores of intercellular clefts that allow molecules larger than plasma proteins such as horse radish to pass through as reported with photographs by Karnovesky [19]- hence nullify oncotic pressure in vivo. Starling’s hypothesis was made into a law with equations later after Pappenheimer and Soto-Rivera’s report in 1948 [24] despite their serious experimental error. Based on these above facts the capillary haemodynamic should work as G tube not Poiseuille’s tube that simply proves Starling’s hypothesis and law with equation are wrong on both forces.
In fairness to Professor Starling, who was a great physiologist, he never wrote any equations nor proposed a law. I have reported 21 reasons affirming Starling’s law is wrong [7]. Here I affirm that Starling’s law is wrong on both of its forces [8-11], and the equations must be also wrong. This applies the principle of what is built on wrongdoing must also be wrong.
Both physics [8-11] and physiological [10] evidence demonstrate that the capillary works as G tube in which the arterial pressure induce negative side pressure gradient that causes absorption by suction not filtration that occurs maximally near the inlet. This is based on hydrodynamic of the G tube presented here. It has also been demonstrated that the oncotic pressure does not exist in vivo as the capillary has wide intercellular cleft pores that allow molecules larger than plasma proteins to pass through it [19]. Hence the oncotic pressure does not exist in vivo [7-11]. Starling’s law is thus wrong on both of its forces and the equations must also be wrong.
The new results reported above affirm that not only Starling’s law is wrong but also provide the correct replacement for it: The magnetic field-like flow of hydrodynamics of the porous orifice (G) tube [8-11] (Figure 5 SI). Please allow me to explain how I reached that conclusion and further present the full plenary evidence in support of it.
The clinical significance of replacing Starling’s law: This article’s deeper and original endpoint objective:
Physiologists and physicists may be reluctant to support the truth brought about by the discovery of the hydrodynamics of the G tube denying its applicability to the capillary hemodynamic, being most concerned about formulae and calculations. Physicians, however, particularly Anesthetists, Surgeon, and Intensivists are most concerned about the lives and safety of their shocked, acutely ill patients and patients undergoing major surgery. Physicians who must rely on Starling’s law for giving intravenous fluid therapy in clinical practice do realize the seriousness of this affair. These Physicians know that Starling’s law does not hold in these clinical settings: Being wrong has induced errors and misconceptions on fluid therapy [26]. These errors mislead physicians into giving too much fluid during the resuscitation of shock, acutely ill patients, and prolonged major surgery [27]. It thus induces the volumetric overload shocks (VOS) [15] also reported as volume kinetic (VK) shocks [16] that cause the acute respiratory distress syndrome (ARDS) [11, 13, 14].
Not only the exact patho-aetiology of ARDS was identified but also a possible prevention and curable therapy is advanced and recommended [13, 14]. So, ARDS is not caused by sepsis and Covid-19 only but also by VOS though remaining unrecognized and underetimated. Sepsis is managable by the use of appropriate and adequate powerful abntibiotics that exist today. Covid-19 that kills its victims by inducing ARDS is transient and will soon go away or a vaccination will materialize that puts it dormant in history like other eradicated infectios diseases by the effective vaccination. Meanwhile, ARDS induced by VOS shall remain unrecognized and underestmated killing hundreds of thousands of patients all over the World each year unless Starling’s law is disposed off and better policy on fluid therapy is implemented and every practicing physician in the World particularly those involved in fluid therapy knows about it.
The faulty Starling’s law is the primary culprit responsible for the death of hundreds of thousands of ARDS patients every year all over the World [11,13,14,28]. This is preventable and curable when the truth on the G tube discovery can prevail and shine. All should welcome the new discoveries in physics, physiology, and medicine [12]. The physics, physiological and clinical evidence is so overwhelming that it justifies saying farewell: “Goodbye Starling’s law, hello G tube” [29].
The second endpoint objective of this article is a final attempt to persuade editors, peer reviewers as well as my hardest of critics among physiologists and physicists who should do the calm and honorable act of accepting the hydrodynamics of the G tube as the correct replacement of the wrong Starling’s law. This law shall be discarded and replaced by physicians whether others like it or not for the reasons mentioned above on the clinical significance of replacing Starling’s law. However, if after reading this article anyone who may still have doubts, concerns and/or criticisms for which no answer was found in a related article of self-references found on Google Scholar search for the author’s name, please do write an email/letter to the editor or the author and you shall receive a satisfactory response.
Section 1: On the current engineering microvascular and capillary ultrastructure anatomy, and correct physiology on pressure and RBCs speed or CBS
The article by Sharon Fletcher et al [30] stated: “The body’s vascular network is organized in hierarchal, tree-like structures with complex and diverse branching configurations designed to efficiently exchange oxygen, nutrients, and waste within and between tissues throughout the body. Large arteries (>6 mm) carry oxygenated blood to smaller arteries (1–6 mm), and then to the arteriolar network (100–1000 µm), and finally into capillary beds (10–15 µm). Tissue engineers have developed numerous methods to fabricate functional vessels with diameters ranging from 1 to 10 mm. The microvasculature is composed of a dense, high-aspect ratio network of capillaries (10–15 µm) located within <100>
The reported RBCs speed or CBS varies from capillary to another and from report to another both in humans [25], and in rats [1,30-32]. Such variation is expected even in the same capillary from point to another as there is a speed gradient from the precapillary sphincter to exit of the capillary. What matters most here is the speed gradient along the wide lumen tube of G tube and capillary that is responsible for the magnetic field-like flow of fluid between capillary lumen and the surrounding ISF space.
Ivanov et al (2020) [31] reported: “The mean linear red cell velocity for 100 cerebral capillaries 2–5 μm in diameter was found to be 0.79 ± 0.03 mm/sec. In the temporalis muscle the velocity was equal to 1.14 ± 0.04 mm/sec in 123 capillaries and 2.43 ± 0.08 mm/sec in 34 arterioles and precapillaries not more than 5 μm in luminal diameter.”
Ishikawa et al (1998) [32] reported: “Average RBC velocity in the capillary is between 0.73 and 0.99 mm/s.”
Guevara et al (2016) reported [33]: “The mean centreline RBC velocity in normal rats varied between 1.0 and 9.0 mm/s (most of the measurements were taken in vessels ranging between 20 and 80 micron in diameter). As the diameter of the pial artery becomes smaller, the blood flow rate (pi x (diameter/2)2 x (mean centreline velocity/1.6)) tends to become smaller.”
Stücker et al (1996) [25] reported on Resting capillary Blood Velocity in humans: “The mean capillary blood velocity (CBV) rest was 0.47 mm/sec (SD ± 0.37 mm/sec, range 0.14 to 0.93 mm/sec). The average intraindividual difference between max rCBV and min rCBV was 0.30 mm/sec (SD ±0.18 mm/sec). The maximum difference between the capillaries of a single subject ranged up to 0.63 mm/sec.”
I wonder if there is a typing error in placing the decimal point in the reported speed of 0.47 mm/s as
I wonder should it read as 4.7 mm/s. After correction to 4.7 mm/s it is the same value calculated by Grubb et al [2]. The other possibility is that Grubb et al have made the error of misplacing the decimal point. Both authors are kindly asked to verify their data and report back to this journal. However, whether there is an error or not it does not alter the fact that there is a speed gradient between the high speed at precapillary sphincter and the low speed at exit of the capillary [2, 25]. This speed gradient is responsible for the magnetic field like phenomena of the G tube occurring between the capillary lumen and the surrounding ISF space. Both Stucker et al observation (below) and Grubb et al’ data results affirm the presence of speed gradient of RBCs speed in the capillary (Figure 27). This is most important for two fundamental reasons:
It rejects the generally received misconception on RBCs speed in the capillary being “too slow”.
It proves that the magnetic field-like phenomenon of G tube occurs between the capillary and ISF space.
Hence, I shall consider the 3 possible scenarios for the RBCs speed in the capillary:
Assume that an error of placing the decimal point was made by Stucker et al and the data given by Grubbs et al are correct. Then, (Figure 27) is the correct figure to represent the speed gradient along the capillary tube.
If Grubbs et al made the error of misplacing the decimal points then (Figure 27) remains proportionally correct but the Y axis has to change to reflect a range of RBCs speed between 0.87 mm/s and 0.47 mm/s, the gradient slope remains the same as in the presented (Figure 27).
If none of the authors has made an error and the reported speeds are just variations in different capillaries of different species of Humans and rats, then we may consider the speed reported by Ivanov et al 2020 [31]: “The mean linear red cell velocity for 100 cerebral capillaries 2–5 μm in diameter was found to be 0.79 ± 0.03 mm/sec. In the temporalis muscle the velocity was equal to 1.14 ± 0.04 mm/sec in 123 capillaries and 2.43 ± 0.08 mm/sec in 34 arterioles and pre-capillaries not more than 5 μm in luminal diameter.”
The figure of 2.43 mm/s is that at the precapillary sphincter and 1.14 mm/s is for the speed at the capillary exit. The slope of the speed gradient in that case is shown in (Figure 28). If the lower figure of 0.79 mm/s is used as the speed at the distal end of the capillary, then the slop of gradient becomes steeper which is more affirmative that the magnetic fluid like fluid exchange dose occur between the capillary and the ISF space.
Stücker et al (1996) also observed [25]: “Another reason for slow CBV may be that the velocity was assessed in the venous limb of the capillary loop, whereas usually CBV is lower than the velocity in the arterial limb, as in our device the venous and arterial capillary limbs of the capillary loop are sometime relatively hard to distinguish.” This observation affirms the speed gradient of RBCs speed along the capillary from the sphincter to the exit.
Grubb et al (2020) [2] did not do direct measurements of CBS or RBCs speed and pressure neither at the arterial nor the venous end of the capillary. The values reported by Grubb et al (2020) [2] are derived from formulae above the graph (Fig.2g) (Figure 30) where they stated in the legend: “At rest, the average RBC velocity through precapillary sphincters was 8.7 ± 0.6 mm/s (Fig. 4c), significantly higher than for the bulb (3.6 ± 0.6 mm/s) and the first order capillary (4.7 ± 0.6 mm/s), but correlated with the relative differences in the resting diameters of the vessel segments.”
Off course the RBCs speed is correlated with the diameters of the precapillary sphincter and that of the capillary lumen specifically at exit. The remaining wide diameter part of the tube has different RBCs speed according to the gradient between the high figure at precapillary sphincter and the low figure at the exit of the capillary. This is related to the fluid jet’s dynamic diameter that changes from 5 µm as rest diameter of the precapillary sphincter at inlet to 10 µm as the diameter of the capillary tube. It is the diameter of the jet in the lumen of the wide section tube that operates in the equation along the whole length of the wide section G tube or capillary.
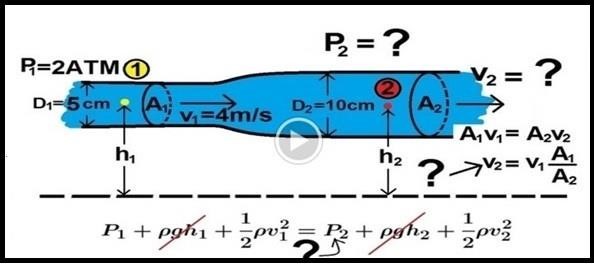
Grubb et al [2] derived the above values from the equation show in (Fig. 2g) (Figure 30) or perhaps from Bernoulli’s equation, where V1A1=V2A2. So, V2=V1 A1/A2 (Figure 31).
The low PP shown in (Figure 16) of this report is lower than the MHP measured by Landis at the arterial end of the capillary and is certainly adequate for inducing the dynamic FP and SP in the capillary as shown in the G tube (Figure 19,20,29)
In the capillary as in the G tube, the speed of flow in the capillary shown in Dr Mayrovits’ video is “very fast”, and certainly cannot be described as “very slow” as generally believed and taught in current classical teaching on the capillary circulation, so there is no “diffusion” here and the word must be corrected in the title of this article [2].
The fluid transfer of the G-C model (Figure 5 SI) occurs according to a precise fast circulation of fluid between the G tube lumen and surrounding chamber C (Figure 12 SI). This must also occur in the capillary, not the slow diffusion, that provide good adequate irrigation of the ISF space without oedema formation, that can account for the cell demand at rest and for higher demand of oxygen and nutrient delivery with removal of waste products during strenuous physical activity.
Now more issues of concern to the hardest of critics are discussed under the following sections addressing authors who are in support of Starling’s hypothesis and the RSP [1-4]:- Section 2: A Brief Historical perspective on landmark articles on Starling’s hypothesis
The history of capillary hemodynamic started with Staring’s reports in 1886 [21] and 1896 [22]. The two main forces of Starling’s hypothesis are: the hydrostatic pressure causing filtration maximum near the inlet as based on Poiseuille’s work in strait uniform brass tube. The opposing force of oncotic (osmotic) pressure of plasma proteins (albumin) causes absorption. A balance between these two forces is presumed to cause a state of “perfusion” balance between the capillary and ISF space. The two similar minor opposing forces in the ISF space are disregarded in this discussion. Landis reported his article in 1927 [23]. He measured the hydrostatic pressures at the arterial and venous ends of the capillary and reported 32 and 12 mmHg, respectively.
Chambers and Zeweifach (1946) [34] wrote: “The muscular component are narrower than most of the true capillaries in the bed”, indicating the presence of precapillary sphincter was known then. Pappenheimer and Soto-Rivera [24] reported their research results in 1948. After that Starling’s hypothesis was transformed into a low with equations.
In fairness to Professor Starling, who was a great physiologist, these authors [4] correctly wrote: “When Starling proposed his hypothesis in 1896 [22], on the capillary interstitial fluid (ISF) transfer and oedema formation he never wrote equations nor proposed a law.” Starling’s hypothesis was transferred into a law after Pappenheimer and Soto-Rivera report in 1948 [24]. The ultrastructure anatomy of the capillary of the precapillary sphincter and the inter-cellular cleft pores were discovered in 1967, by Rhodin [18] and Karnovesky [19] respectively.The wide intercellular capillary pores nullify the oncotic pressure in vivo. Multiple criticisms of Starling’s hypothesis brought about RSP as an attempt for repair [3,4]. Guyton and Coleman in 1968 reported the pressure of the ISF space in a subcutaneously implanted capsule to be -7 cm water [20] that cannot be explained by Starling’s forces. Despite reporting 21 reasons affirming Starling’s law wrong and the correct replacement is the hydrodynamics of the G tube [7], Starling’s law has remained accepted till curent time of writing this report. There are hard critics who still believe RSP is the saviour of Starling’s hypothesis [3,4].
Ghanem reported the hydrodynamics of the G tube as preliminary report in 2001 [8] demonstrating its relevance to the hemodynamics of the capillary and as well as its clinical significance proposing the G tube phenomenon of magnetic field-like fluid circulation between the capillary lumen and ISF space as the correct replacement for Starling’s law and hypothesis [8-11]. I shall leave it up to history, that will certainly be kinder and fairer to me than some editors of top Science and Medical Journals, to decide if my name is worth mentioning at the end of the above list as based on my contributions on the subject of G tube physics and capillary physiology [6-11] and resolving the puzzle of ARDS [11, 13, 14] as well as identifying 2 new volumetric overload shocks [15, 16]. Not only the exact patho-aetiology of ARDS was identified but also a possible preventable and curable therapy was suggested [13, 14]. History may record: “Ahmed N. Ghanem is a man doctor surgeon who was Eastbourne and educated up to university degree in Egypt, came to Eastbourne in the United Kingdom for further postgraduate education and training to demonstrate to scholar’s peers in the West later that the impossible can be achieved and made possible without external funds whatsoever.”
Section 3: Hydrodynamics of the porous orifice (G) tube: What are the new physics discoveries of physiological relevance?
The results of the presented study clearly indicate and recognize the following new discoveries of the G tube:
There is a major difference between the hydrodynamic of Poiseuille’s tube and that of the G tube as compared in (Figures 1 and 2 SI).
There is also a difference between the hydrostatic and hydrodynamic pressures of FP and SP.
The lumen pressure components of the dynamic fluid flow of FP and SP are precisely identified and measured in both Poiseuille’s tube (Figure 15 SI) and the G tube (Figure 16 SI) in the circulatory model and in isolation (Figures 1,2 SI).
The SP in the G tube causes negative pressure gradient exerted on the wall maximum near the inlet (Figure 4, 5 SI) and turns positive pressure maximum near the exit (Figure 2 SI).
Thus, in the G tube suction or absorption of fluid occur through side holes near the inlet while filtration occurs through holes near the exit.
This creates the unique autonomous rapid dynamic magnetic field like fluid circulation in a surrounding chamber (C) between fluid around the G tube and fluid inside its lumen (Figure 5, 12 SI).
The negative SP of the G tube creates net negative pressure in chamber (C).
The flow in chamber C is in the opposite direction to the flow of fluid in the G tube lumen as shown in (Figure 5, 12 SI).
The G tube’s magnetic field like fluid circulation phenomenon between fluid inside its lumen and that surrounding it in chamber C works in both macro and micro tubules, such as the capillary, alike as based on the physiological evidence [10] and other evidence presented here.
The presumed slow RBCs speed as it passes through the capillary is incorrect (see later). Modern videos on the speed of flow in the capillary circulation shows RBCs running fast (The video is
available on Thomas Woodcock’s Blog [3] and reported by HN Mayrovits < http://fluidphysiology.org/2020/05/25/more-on-ghanems-hypothesis/> <
https://youtu.be/QuWhKN1bHLA>. The speed of RBCs or blood flow in the capillary shown in this video is fast enough to induce the magnetic flow phenomenon of the G tube in the capillary. The speed of flow in the capillary shown in this video is “very fast”, and certainly cannot be described as “very slow” as generally believed and taught in current classical teaching on the capillary circulation.
As mentioned here later the RBCs speed or CBS is 8.7 mm/s at the pre-capillary sphincter and 4.7 mm/s at the exit of the capillary reported in rats [2] and in humans with uncanny similarity after correction [25]. The speed gradient between the two recorded speeds is that that matters in inducing the G tube magnetic field like phenomenon in the capillary.
The RBCs speed or CBS run down a slope of gradient from pre-capillary sphincter to exit of the capillary, from 8.7 mm/s to 4.7 mm/s [2]. This speed gradient induces the magnetic fluid-like flow phenomenon of the G tube between the blood flow in capillary lumen and the surrounding ISF space. This FAST capillary-ISF transfer is essential for the viability of tissues and cells under rest conditions and strenuous exercise. Substantial evidence on this issue with supporting graphs is reported here, particularly as the driving pressure in the capillary of 32 mmHg [2] is higher than proximal pressure in the G tube of 24 cm water.
The hydrodynamics of the G tube demonstrate that the dynamic pressure of a moving fluid has 2 pressures components that are different from the hydrostatic pressure of a stagnant fluid:
The flow pressure (FP) that is in the direction of flowing fluid measured with a cannula or needle facing up stream. It exists in both Poiseuille’s and the G tube and is high positive pressure.
The side pressure (SP) that is lower than FP in Poiseuille’s tube and is measured with a cannula or needle facing downstream or sideways.
The negative SP is unique to the G tube causing negative pressure and suction over the proximal part of the G tube maximum near the inlet (Figure 4,5,12 SI,23,24) and turns gradually into positive pressure gradient maximum near the exit (Figure 2,16 SI).
Both FP and SP of a dynamic flow are different from the hydrostatic pressure measured with a cannula occluding the lumen of the tube. This is reported here as the MEASURED hydrostatic pressure (MHP) of the tube flow as measured by Landis in the capillary [23], which induce the SP gradient that induces the magnetic field like phenomenon of the G tube in the capillary as shown in (Figure 5 SI).
Section 4: The physics and physiological relevance of the hydrodynamic of the G tube to the hemodynamics of the capillary specifically Starling’s law on the capillary-ISF transfer
This has been previously reported [8-11] and affirmed here. The clinical significance of applicability of the hydrodynamics of the G tube to the patho-aetiology of the new volumetric overload shocks (VOS) [24] also reported as volume kinetic shocks [25] causing ARDS [11,13,14] have also been reported.
In view of the above presented results, now critical analytical evaluation and assessment of the following landmark articles and current impactful reports that identify the errors made permitting the transfer of Starling’s hypothesis into a law with equations are demonstrated here:
Section 5: Analyzing Landis’ report on the measured arterial and venous pressures in the capillary. Results of new physics experiments on both the G tube and Poiseuille’s tube demonstrate that if the measuring cannula facing up stream totally occludes the lumen of the tube, it transfers the two dynamic pressure components of FP and SP into one high positive hydrostatic pressure only that does not reveal anything about the negative SP. This is what Landis [20] did when he measured the capillary lumen pressure at the arterial and venous ends of the capillary. He measured the MEASURED hydrostatic pressure that reflected the flow pressure (FP) but does not show any signs about the dynamic negative SP that is exerted on the wall of the capillary- not FP. The occluding measuring cannula, out of necessity on reaching pressure balance of measurement, stops the tube flow thus the 2 dynamic pressures of FP and SP are transferred into only one high positive hydrostatic pressure, and the negative SP disappeared. The values Landis obtained for this
MEASURED hydrostatic pressure (MHP) at the arterial and venous ends of the capillary were 32 and 12 mmHg, respectively. This clearly demonstrates a descending FP pressure gradient or MHP gradient along the capillary (Figures 19, 27, 28). I hope future research will measure the RBCs speed or CBS at both arterial and venous ends of the capillary that will demonstrate a similar descending speed gradient slope as documented here based on currently available research data. It is based on calculations from formulae above (Fig.2g) [2] (Figure 30)- with the reservation of the RBCs speed of 4.7 mm/s applies only at the distal end of the capillary not the entire capillary tube. Section 6: Criticizing Pappenheimer and Soto-Rivera’s report
The report by Pappenheimer and Soto-Rivera in (1948) [24] was the main reason for the transformation of Starling’s hypothesis into a law. These authors thought that elevating the capillary pressure may be achieved by elevating the venous pressure or arterial pressure alike, matching mmHg for mmHg, and they reported this to be in support of Starling’s hypothesis. However, this also has proved wrong, as demonstrated in the G tube and Poiseuille’s tube experiments as well as evidence from clinical practice: Elevating distal pressure (DP) akin to venous pressure augments filtration as shown in graph (Figure 11 SI) and in clinical practice causes oedema formation while elevating proximal pressure (PP) akin to arterial pressure or MHP does not, it enhances suction or absorption via the negative SP maximum near the inlet of the G tube as shown in graph (Figure 10 SI).
In support of the above fact is: High venous pressure, or obstruction, is the main cause of the most common clinical oedema but arterial hypertension though quite common it never causes oedema. Off course neither Starling nor any of the authors who transferred his hypothesis into a law were aware of the brilliant discoveries of precapillary sphincter [18] and wide porous wall of intercellular clefts of the capillary that allow the passage of plasma proteins thus nullifies oncotic pressure in vivo [19] that were discovered later in 1967. The G tube discovery demonstrate PP akin to arterial pressure induce negative pressure gradient exerted on the tube’s wall that is maximum near the inlet causing suction or absorption. So, both Starling’s forces are wrong.
The same wrong conception that elevating CVP to levels of 20-22 cm H20 may elevate the arterial pressure in shock by infusing too many fluids was prevailing in clinical practice till recently. Fortunately, such practice has stopped now since it was realized that it induces volume kinetic shocks [15, 16] that cause ARDS [13, 14, 28].
It is worth mentioning the relation of G tube orifice diameter to SP of the G tube and the surrounding chamber C pressure (CP) shown in (Figure 9 SI). This is relevant to the negative ISF pressure measured by Guyton and Coleman subcutaneously to be of -7 cm water [20]. This negative pressure of the ISF space can only be explained by hydrodynamics of the capillary working as G tube (Figures 4-7, 10 SI). Starling’s forces cannot account for this negative pressure of ISF space and lymph vessels at all.
Section 7: Criticizes Grubb et al report [2] on the calculated capillary pressure and red blood cells (RBCs) speed or capillary blood speed (CBS).
I commend and congratulate the authors on their brilliant timely article [2] on the role of precapillary sphincter and its primary importance in regulating blood flow and pressure into the cerebral cortex as well as every other tissue and organ in the body. Their tremendous effort of conducting this awesome research work is most appreciated. However, I fear that some of the authors’ derived physiological values particularly CBS or RBCs Speed and pressure are inaccurate due to a fault that is not their own. They were being misled by many errors and misconceptions transferring Starling’s hypothesis into a law, and by inadequacies of Poiseuille’s law and Bernoulli’s equation as explained here. This has led to some incorrect derived results, graphs and conclusions highlighted by wrongly using the word “perfusion” in the title of their article. This is a common and prevailing physiological misconception that RBCs speed in the capillary is “very slow” to allow for the slow “perfusion” of fluid and particles from the capillary to ISF space and cells found in all current textbooks and physiological teaching on the capillary-Interstitial fluid (ISF) transfer.
The word “perfusion” is based on the currently accepted physiological law of Starling’s forces that are generally believed to regulate the capillary-ISF transfer through “perfusion” balance influenced by its 2 main forces. The 2 main forces of Starling’s law believed to induce this “perfusion” balance state are the hydrostatic pressure of the capillary causing filtration, and the osmotic (oncotic) pressure of plasma protein (albumin) causing absorption. Here I demonstrate that Starling’s law is wrong on both forces and the correct replacement for it is the hydrodynamics of the porous orifice (G) tube. The physics evidence was preliminary reported in 2001 [8], emphasized 2017 [9] and concluded in 2020 [11]. The physiological evidence was reported in 2017 [10].
The porous orifice (G) tube was built on a scale to the capillary ultrastructure anatomy of precapillary sphincter [18] and the wide intercellular cleft pores [19] that allow the passage of plasma proteins, hence nullify the oncotic pressure in vivo. Investigating the hydrodynamics of the G tube, and contrasting it to Poiseuille’s tube, demonstrated that the hydrostatic pressure is different from the 2 hydrodynamic pressures of moving fluid: The flow pressure (FP) responsible for the flow and works in its direction only, and side pressure (SP) exerted on the tube’s wall in a perpendicular circular direction. The hydrodynamics of the G tube are totally different from Poiseuille’s tube.
The G tube has a negative SP gradient that is maximum negative near the inlet and turns gradually positive to become maximum near the exit. Thus, in the G tube suction or absorption of fluid occur through side holes near the inlet while filtration occurs through holes near the exit. This creates the unique autonomous rapid dynamic magnetic field like fluid circulation in a surrounding chamber (C) between fluid around the G tube inside C and fluid inside its lumen. The negative SP of the G tube creates net negative pressure in chamber (C). The flow in chamber C is in the opposite direction to the flow of fluid in the G tube lumen. This magnetic field-like fluid circulation (Fig. 5 SI) regulates the fast capillary-ISF transfer that can provide for the cell’s viability at rest and exercise, not the slow perfusion.
To make the issues absolutely clear may I gently remind the authors that the hydrodynamic of the G tube demonstrates that there are 2 dynamic pressure components of a moving fluid in any tube such as Poiseuille’s or the G tube that are different from the hydrostatic pressure.
The 2 dynamic pressure components are:
Flow pressure (FP) in the direction of flow that is high positive in both Poiseuille’s and G tubes and is responsible for the flow.
Side pressure (SP) exerted on the tube’s wall that is positive but lower than FP in Poiseuille’s tube. This SP is negative pressure gradient in the G tube maximum negative near the inlet and turns positive maximum near the exit. The negative SP of G tube is demonstrated in diagram shown in (Figure 5 SI) that is based on many photographs reported here. This SP creates net negative pressure in a chamber C surrounding the G tube.
The authors used a graph with the modified equation above the graph (Fig. 2g) shown here as (Figure 30) for calculating the values of (ΔP) as well as the RBCs speed or CBS:
It can be immediately demonstrated that the equation and the graph are wrong as there is a definite negative pressure exerted on the wall of the constriction of the tube exactly at the precapillary sphincter that is well known as the Venturi’s effect. Neither the equation’s (ΔP) nor the graph demonstrates this negative side pressure exerted on the wall of the precapillary sphincter.
Similarly, the calculated RBCs velocity assuming it means the same as CBS as based on the above given equation in the precapillary sphincter lumen as well as the bulb and proximal capillary gives a “slow speed” of “a single value” that may be wrong considering the fact that the RBCs speed is high over the proximal part of the capillary, that includes both the bulb and proximal capillary. It then gradually decelerates or slows down towards the end of the capillary or G tube. The equation does not reflect this CBS gradient that is fast at orifice where the speed of the ejected blood jet from the orifice of the capillary (the precapillary sphincter) is the same as in the bulb area and remains high in the proximal capillary, then gradually decelerates towards the exit end of the capillary (more is presented later with graphs).
Section 8: What is wrong with Poiseuille’s law and missing in Bernoulli’s equation to show the negative SP over the precapillary sphincter and proximal capillary, respectively?
Here I criticise Poiseuille’s law and Bernoulli’s equation’s applicability to the hydrodynamics of the G tube and hemodynamic of the capillary. Both Poiseuille’s law and Bernoulli’s equation certainly have proved great in aerodynamic allowing us to fly aeroplanes and reach the moon and anchor the roofs of our houses so firmly that it does not get blown away by hurricane winds as well as in many applications in life. However, despite great applicability in hydrodynamic they have not helped physicians to practice precision medicine by being inapplicable to the hydrodynamic of the G tube and the hemodynamic of the capillary.
Case in point, is this awesome article with tremendous amount of work ending up with the wrong conclusion reflected by using the wrong word “perfusion” in the title of their report [2]. This is based on using Poiseuille’s law, and possibly Bernoulli’s equation, for deriving the values of pressure and RBCs speed or CBS particularly at the precapillary sphincter and the proximal part of the capillary. This pressure and CBS are of primary importance in discussing the hemodynamic of the capillary and the hydrodynamics of the G tube to see whether they are identical.
The authors used Poiseuille’s law and its modification for calculating the pressure and CBS over the precapillary sphincter represented by the graph in (Fig. 2g) reproduced here as (Figure 30). They stated in the legend that: “Illustration of a pressure decrease across a precapillary sphincter and modified expression of Poiseuille’s law” as shown here:
The authors wrote in the legend: “(ΔP equal the term on the right, where P is pressure (which pressure; FP, MHP or SP?), μ is dynamic viscosity, L is length (of what?), Q is flow, and r is vessel radius (of what?)”. The bold questions marked in brackets are added by me to highlight what P, L, and r or D refer to exactly, particularly in the wide lumen after constriction of the tube?
In this Illustration of Poiseuille’s law the authors continued in the legend: “Illustration showing how the pressure drop (defined as pressure difference per unit length times viscosity, ΔP depends on the cylindrical lumen diameter and flow velocity. Note how the pressure drop increases with lumen diameters below 4 μm. Lower right: Combining flow resistance in laminar fluid flow with Poiseuille’s law yields an equivalent representation of how flow resistance (defined as resistance per unit length and viscosity, R μL) depends on lumen diameter.”
The authors applied this Poiseuille’s law and modification above (Fig. 2g) to calculate the pressure at the precapillary sphincter. Does Poiseuille’s law in the above situation yield results that demonstrate the presence of Venturi’s effect at the orifice of precapillary sphincter? The answer is obviously NO as the result of calculation cannot yield a negative value. The same question applies on attempting to calculate the CBCs speed or CBS in the body of the capillary itself as the wide section of the tube after the precapillary sphincter and similarly in the G tube, particularly starting at the precapillary sphincter (orifice) as well as in the bulb and the proximal part of the capillary where the pressure exerted on the wall is also negative causing suction as demonstrated in the G tube in the above reported results.
The value of the Venturi’s effect or ΔP at the precapillary sphincter should be expressed as a negative unit of pressure (-mmHg, or -cm H2o or -Pascal)- the negative sign is a must over in the orifice of precapillary sphincter and the proximal part of the capillary, and should also show in the graph (Fig. 2g). There is no negative sign in Poiseuille’s law shown above or its modification that allows for such calculation. So, the graph (Fig.2g) is wrong. This is just one example of other graphs using the derived pressure and CBS in the precapillary sphincter as well as the capillary itself particularly over the proximal part.
We now know from the G tube experiments that the fast fluid jet coming out of the narrow orifice of the precapillary sphincter and remains fast for a distance inside the lumen of the proximal part of the capillary as in G tube (Figure 5 SI) and also in bulb and the proximal capillary induces the negative SP gradient. So, ΔP should show a negative value over the proximal part of the capillary that revert to positive over the distal part. Correcting this error require adjusting Poiseuille equation if possible, otherwise Bernoulli’s equation may be an alternative that might reflect the negative pressure change in the precapillary sphincter and the proximal part of the capillary. I think that Bernoulli’s equation has the same problem of currently not being able to correctly calculate SP because P and ∆P are used in it without being precisely defined.
There are other variables in the equation that require precise definition such as L and D what are they? So these dynamic variables in an apparently impossible future equation or equations should include the following:
The FP gradient for (FP and ∆FP) for which the measured hydrostatic pressure (MHP) may be used such as that measured by Landis at capillary inlet and exit (MHPinlet and MHPexit)
The SP gradient for (SP and ∆SP) as measured in the G tube (Figure 17, 18 SI)
The fluid jet diameter gradient (Dj) at precapillary sphincter (Dj inlet) and at exit of the capillary (DJ Exit) (Figure 5 SI).
The fluid jet length (Lj) not the tube L? (Figure 17 SI)
The G tube or capillary length for L?
The CBS or RBCs speed at inlet and exit of the capillary (CBSinlet and CBSexit) as calculated and reported by Grubb et al [2] and Ivanov et al [31], and also after correction of value to 4.7 mm/s in the article by Stucker et al [25] who suggested that RBCs speed should be measured in future at both arterial and venous ends of the capillary.
As all these dynamic variables are measurable, thus the equation may be easier than and probably not as daunting as it appears at first sight.
Perhaps it is relevant and important to say something on the resistance and viscosity of blood passing through the capillary’s wide section tube. There is no resistance except at the end of the capillary where the fluid jet touches the inner surface of the glycocalyx membrane lining the capillary endothelium. The viscosity of blood over the entire length of the capillary is that of serum (close to water) devoid of all cellular elements and plasma proteins by the clear zone around the fluid jet inside the G tube demonstrated in the diagram shown in (Figure 5 SI).
After finding the correct equation, modified or new, for calculating FP, SP, CBS, or RBCs speed new graphs should be done. The negative pressure should be expressed as negative value in the graph as shown in (Figures 23, 24). Perhaps the way to calculate this SP force is to use the Bernoulli’s a new equation used to calculate the pressure and upward force lift- like the lift exerted on aeroplane’s wings, and house’s roof by hurricane wind in which a small difference in pressure induce a great force. Even more directly the fluid flow from a narrow to wide diameter tube as shown by Professor Michel van Biezen [YouTube, Michel van Biezen, lectures] (Figure 31)
https://youtu.be/R5uoTadxhpU,https://youtu.be/VA03j6t5F-8, https://youtu.be/LMDxv96XluY, https://youtu.be/cUMspps8d8A].
Watching these great lectures videos may help physicists to solve the problem. The diagram and Bernoulli’s equation are reproduced here as (Figure 30-32).
The negative SP at the orifice or precapillary sphincter is well known as the Venturi’s effect. The equation used by the authors in (Fig. 2g) does not represent that at all, neither does the graph show a pressure with negative value. The equation may work when RBCs speed or CBS slows down, and the pressure turns positive over the distal part near the exit. Note also that the pressure in the wider section of the tube such as the capillary or the G tube is a descending gradient not just one fixed value. This CBS or RBCs speed is higher at the inlet of 8.7 mm/s and slower at the exit of 4.7 mm/s of the capillary and the G tube. The flow pressure (FP) and CBS are higher at the orifice and lower at the exit of the capillary and G tube. See the new graphs (Figures 19-29).
In case of difficulty in finding the correct Bernoulli’s equation that yields the negative SP over the proximal part and positive SP over the distal part of the capillary and G tube, I recommend that please consult with Professor Michel van Biezen who understands the dynamic applicability of Bernoulli’s equation so well he should be able to resolve the issue for us. I tried to contact him by email twice but have not received a reply. I watched all his lectures on Bernoulli’s equation at YouTube and he kept saying: “When the velocity goes up the pressure goes down, and when the velocity goes down the pressure goes up”, but he never said that the pressure may become negative as in Venturi’s effect at precapillary sphincter and Bernoulli’ principle in the proximal part of the G tube. In one or two of all Professor Michel van Biezen’s brilliant lectures on Bernoulli’s equation, particularly those on Aeroplan lift and roof of the house lift by hurricane referenced above, he said:”A small difference of pressure can induce a tremendous force that lifts the Aeroplan and keeps it up in the air, and the house’s roof up in the air and throws it away.” I believe this is the kind of force that works in the G tube and the capillary that drives the magnetic field-like fluid circulation reported above.
It becomes clear that this G-C circulation represents the capillary-ISF circulation as shown in (Figure 5). The G tube phenomenon works in capillaries as based on the physiological evidence [10] as well as modern video on the speed of flow in the capillary circulation (The video is available on Thomas Woodcock’s Blog [3] and reported by Dr HN Mayrovits- URL is given above). The speed of blood flow in the capillary shown in this video is fast enough to induce the magnetic field-like flow phenomenon of the G tube in a capillary.
It is worth noting the gradient of RBCs speed or CBS, observed by Stücker (1996) [21], along the capillary length that is high at the inlet and low at the exit of the capillary. This CBS gradient is responsible for inducing the G tube phenomenon in the capillary. Grubb et al report a similar gradient value of CBS or RBCs speed [2]- irrespective of the individual speed’s reading value. Currently there is no study that compares the CBS or RBCs speed at the arterial and venous ends of the capillary that should demonstrate the declining speed gradient along the capillary’s length. This study is recommended and needed for validation of the G tube theory.
Furthermore, the reported above data of G tube FP in relation to tube’s length and fluid jet length is shown in (Figure 16 SI, 19). I trust that the authors [2] have adequate data and capability to correct the erroneous conclusions and the title as based on the given references and report back a correction in Nature as soon as possible. Hundreds of thousands of patients’ lives per year who suffer from ARDS depend on it as sumarized here and explained in detail in previous reports [13, 14, 28].
Section 9: Criticizing Dalwadi et al Mathematical Model to determine the effect of sub-glycocalyx space that the authors themselves report that this space is of doubtful existence.
This is the one section of this article and criticism that I despise most being the heaviest on my heart for fear of upsetting the respected authors to the effect that they might hate me for it. I shall do my best to be as humble, kind, sympathetic, commiserative, and considerate as I possibly can while, like a good surgeon, having to do a necessary major lifesaving but may be painful surgery.
Allow me to start by pointing out a contradiction in the authors’ statements in the article’s introduction. The authors stated that: “The endothelial glycocalyx (eGlx) is a coating found on the luminal surface of most blood vessels [1, 2]. Later they stated: “It acts as a molecular sieve for plasma proteins.” There is an obvious contradiction in these two statements by the authors [1]. The porous eGlx does not act as molecular sieve for plasma proteins if plasma proteins can pass through it. It does act as sieve for the platelets and cellular elements of the blood not for plasma albumin. So, let us agree that eGlx permits the free passage of plasma proteins but, the fact that albumen only passes in small amounts to the ISF space require an explanation.
Observations from the G tube in the G-C model in a circulatory system on the fine tea leaves’ behaviour in the circulatory model presented in the diagram in (Figure 5 SI) demonstrate that tea leaves like plasma proteins do pass into the surrounding chamber C (akin to the ISF space) in small amount at distal pores governed by only the kinetics of the fluid passing through the lumen of the G tube and capillary. This happens mostly through the distal pores of the G tube as the small size tea leaves behave in the G-C apparatus demonstrated in the diagram (Figure 5). Thus, the concentration of the fine tea leaves remains high in the circulation than in the surrounding chamber C around the G tube (akin to plasma albumen and ISF space).
The authors also stated “As blood plasma drains from the lumen on its way to the interstitium (ISF space), it first passes through the porous eGlx attached to the endothelial cells. The impermeability of the endothelial cell body means that in nonfenestrated vessels the only route to the interstitium is through the small gaps between these cells, referred to as the intercellular clefts discovered by Karnovesky in 1967 [19].” That is completely acceptable and correct.
Hence plasma proteins do pass into the ISF space through the wide pores of intercellular clefts governed only by the dynamics of the blood fluid passing through the capillary as demonstrated in the G-C model represented diagrammatically in (Figure 5 SI) that is actually based on several photographs reported here. On that understanding I like and accept the diagram by the authors [1] shown in (Figure 33) reproduced here.
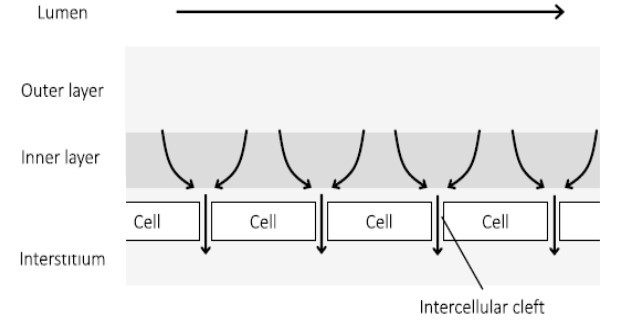
The authors are correct in saying: “In nonfenestrated vessels (capillary) the only route to the interstitium is through the small gaps between these cells, referred to as the intercellular clefts [19].” These intercellular clefts were most clearly reported by Karnovesky in 1967 [19], who most clearly demonstrated with photographs that horse radish molecules, which are larger than plasma proteins, freely enter these intercellular clefts and pass to the ISF space. This surely nullifies the oncotic pressure in vivo. Surly you should agree that this fact on its own proves Starling’s law and its equation wrong as one of its main forces of oncotic pressure has cancelled out.
Accepting the above may prove that all the complex equations and RSP are totally unnecessary and unrequired, particularly as the authors stated that the sub-glycocalyx space is of doubtful existence. It does not make any difference whether it exists or not as it plays no rule in fluid and proteins flux across the capillary wall! It only provides a smooth inner coating of the blood vessels and the capillary that is crucial for the capillary to function as the G tube. Any irregularities at the inner surface of the capillary disturbed the magnetic field like circulation.
Further discussion and arguments may no longer be necessary. End of debate? If not, tell us your concerns and criticisms and you will get a satisfactory answer.
Having said that, I believe the authors have a real good chance to develop an equation that determines the fluid flux through the inter-cellular capillary cleft pores based on the hydrodynamics of the G tube and hemodynamic of the capillary. While they are at it they may try to sort out
Poiseuille’s law and Bernoulli’s equation to allow it to calculate and correctly predict the dynamics of SP exerted on the G tube’s wall that causes suction proximally and filtration distally in the wide section of the G tube as happens in the capillary. This is an extremely hard job to do but I trust the authors are up to the challenge. I know they have the knowledge, experience, data, and capability that allow them and colleagues to achieve that. I cordially invite them to do that and I would look forward to seeing the results.
Finally, please may I most humbly and kindly request that the authors do the calm and honourable act of accepting the G tube dynamics as the correct replacement for Starling’s hypothesis. Hundreds of thousands of ARDS patients’ lives who are killed every year all over the world [13, 14] depend on it. Please join in and say a farewell: “Goodbye Starling’s law, hello G tube.” [27].
Section 10: Criticizing the G tube theory answering the accusations of inapplicability of the hydrodynamics of the G tube phenomenon to the capillary hemodynamic though it is the correct replacement for Starling’s law.
For a convincing answer to the question posed here: “Does hydrodynamics of the G tube work as the hemodynamic of the capillary with precapillary sphincter?” this section is added.
To answer this question the following arguments must be addressed. Objections to the theory of the G tube hydrodynamics that does work in the capillary are based on the following arguments and criticisms:
The results of experiments in macro tubes such as the G tube may not work in micro tubule such as the capillary.
The pressures in the G tube inducing its phenomenon are too high than that in the micro-vessels and the capillary circulation where speed is believed to be “very slow” in current teaching. This is also based on an assumption that the cross-section area of all the capillaries is much greater than that of the aorta.
The speed of fluid flow in the G tube is much too high than RBCs speed or CBS in the capillary, hence the G tube phenomenon is impossible to work in the capillary under such slow CBS. This is particularly important as it is generally believed that RBCs speed and CBS is a “very slow” motion in capillaries to allow for the “perfusion balance” of Starling’s forces to take place”.
My best critic informed me that the hydrodynamic of the G tube working in the capillary is a “physics impossibility”.
Then please, allow me to answer to the above criticisms one at a time.
If it is argued that experiments in macro tubes may not apply to micro tubules such as the capillaries, then Starling’s hypothesis should not have been accepted in the first place and it is invalid now as the hypothesis was based on Poiseuille’s experiments in long brass tubes of large uniform diameter [18,19]. A double standard is refused. The G tube hydrodynamic is the real correct replacement for the wrong Starling’s law as it was designed on the capillary ultrastructure anatomy.
The argument that the G tube phenomena requires high pressure that is not available in the capillary is incorrect. In fact, the G tube phenomenon works under low proximal pressure of 24 cm water as the driving proximal pressure as shown in (Figure 16 SI), which is even lower than the pressure recorded in the proximal capillary by Landis of 32 mmHg at the arterial end. So, the G tube phenomenon does work in the capillary at this low pressure. Please see below for further evidence and discussion with graphs.
I shall challenge that received wisdom on the sum of all capillaries’ cross-section area is greater than that of the aorta later. The issue on RBCs speed or CBF being too slow is also challenged as discussed here, referring to reported data on it from research in human capillaries [21] and rats [2,29-31] that demonstrate a definitive speed gradient between RBCs speed at orifice of 8.7 mm/s and at exit of the capillary of 4.7 mm/s [2]. This speed gradient is adequate for inducing the G tube phenomenon in the capillary.
Answering this criticism is best done by most humbly and simply saying based on evidence reported here it seems that: “achieving the impossible and making it possible is my specialty”! Yes, you may call me a debate terminator.
Section 11: Discusses why the capillary blood flow speed (CBS) or RBCs speed is not “very slow”- as it has a fast speed of the jet ejected from the precapillary sphincter into the proximal part of the wider lumen of the capillary as it does in the G tube with a descending gradient along the tube.
This involves criticising Poiseuille’s law and the ingenious Bernoulli’s equation despite accepting its multiple useful applicability in hydrodynamic and aerodynamic. It has not helped physicians to practice precision medicine falling short of applicability to the hydrodynamic of the G tube and haemodynamic of the capillary pressure and CBS or RBCs speed, requiring a new modification for calculating the RBCs speed and FP descending gradient along the G tube and the capillary. Another new equation for the negative SP may be required. New formulae for calculating the negative SP gradient exerted on the wall of the G tube and at precapillary sphincter (Venture’s effect) and proximal capillary (Bernoulli’s principle) are required.
Section 12: Is on correcting the generally received error that presumes the cross-section area of all the capillaries is greater than the aorta based on which a formula wrongly produces “very slow and fixed speed” of RBCs speed or CBS in the capillary.
This correction is based on the G tube’s newly presented results showing fluid flow (akin to CBS or RBCs speed) is fast with a dynamic descending gradient of velocity along the length of the wide section of the tube (G tube or capillary) (Figures 25-28).
I shall challenge the assumption that capillaries have larger sum of cross section area than the aorta in a future article on the Tree Branching Law (TBL) after validating the theory and law experimentally and mathematically. Now it is based on theory and observations only. This TBL apply to all trees of fibre-optic light lamp tree, mathematical tree and Nature trees including the green trees in houses, on streets, in gardens and forest and the red trees of the Aorta and arteries down to all terminal arterioles and most probably functional capillaries in humans and animals. The TBL is currently based only on an observational theory till now but I shall provide experimental evidence with precise measurements before reporting it soon. The TBL states that: “A tree trunk does not and cannot give rise to branches at any one level that has a sum of cross section areas that is larger than its own. In other words, A tree’s branches at any one level has total sum of cross section areas of less than the trunk or mother branch”.
The tools for the above investigation on TBL have just been delivered by Amazon.com to my UK address and shall be delivered by my daughter Sara to my Cairo address next Saturday 14th September 2020. The time of writing this text is Sunday 30th August 2020. The two items are:
LEDMOMO Fiber Optic Lamp Changing Fiber Optic Light Battery operated Fiber Optic Fountain Night Light.
eSynic Electronic Digital Vernier Calliper with Functions/Inch/Metric Conversion Electronic Vernier Calliper Stainless Steel Body Vernier Calibre with Feeler Gauge for Designer Engineer Teacher etc.
The Fiber Optic Fountain Night Light shall provide instant proof that TBL is correct. The sum of all fibers of the Fountain Night Light Lamp’ s cross section area may equal the trunk gathered by all fibers or less but not more. Evidence on studies of Mathematical tree, Green Trees and Red Tree of Aorta and its branches of Arteries, Arterioles and Capillaries will soon follow to validate TBL. I understand I am taking a high risk challenge here for some interested researcher to prove me wrong, but I trust the theory and observations behind this TBL that never failed me before and it is not going to do so now. So, go on prove me wrong if you dare! Just kidding, I should say if you care, please.
Section 13: On missing data from precision engineering microvascular and capillary ultrastructure anatomy, and correct physiology on pressure and RBCs speed or CBS and suggestions for future research.
In 1983, Mattfeldt and Mall [35] reported the ultrastructure dimensions of capillaries: “The ‘ideal’ capillary is a tube connecting an arteriole to a venule. According to Crogh’s model it is a perfect, anisotropic, straight, and unbranched tube with a diameter of 7-18 µm.”
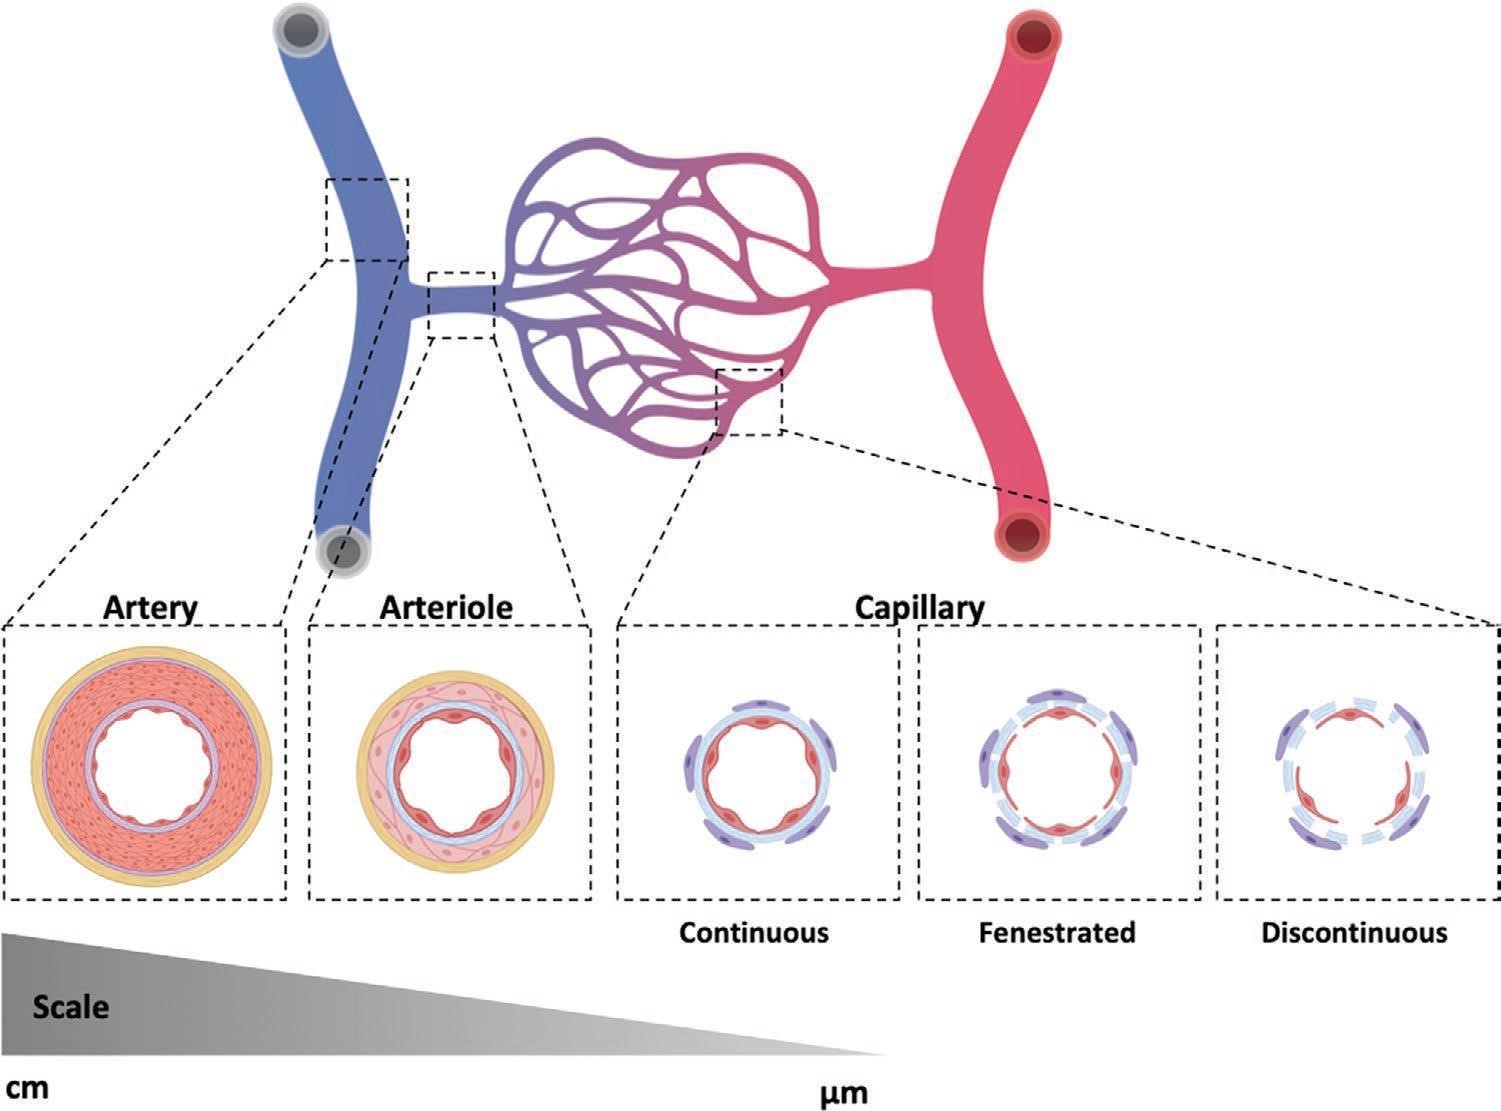
Arterioles and venules are further bound by a second layer of SMCs as well as elastin and collagen fiber/s. Capillaries have a varying extent of basement membrane and pericyte coverage and can be continuous, fenestrated, or discontinuous. Created with BioRender.com.”
Based on data presented in section 1, the diagram reported by Fleisher et al [29] reproduced here as (Figure 34) above violates both Crogh’s model and the Tree Branching Law (see above in section 11). Please reproduce a diagram based on real true life “arteriole-capillaries-venule” model, giving the engineering precise measurements on diameters, length, and number of capillaries and branches with diameters measurements also if any exist. Ideally if feasible an actual photograph with the mentioned measurements is better. In a perfect world the terminal arteriole and capillary pressure and the RBCs speed should be also given. These data allow an actual estimation of the number and cross section areas of all capillaries in relation to the aorta in a human or animal. Also, for no obvious reasons the authors swabbed the red colour of arteriole with the blue colour of venule. The original and natural colour of red should be attributed to the arteriole as it contains oxygenated blood. The blue color should be attributed to the venule as it contains deoxygenated blood. Please Sharon report the correct diagram or picture with the missing data soon.
Muhammad Nabeel Syed et al (2017) [36] reported: “The mean diameter of the ascending aorta (Asc
Ao) in men was 2.91±0.40 cm, compared with 3.34±0.34 cm in prior studies. The mean diameter of Asc Ao in women was 2.70±0.36 cm, compared with 2.98±0.34 cm in prior studies.”. The estimated number of capillaries in adult human has a huge range between 300 million and 10 billion capillaries. Considering the first number as more realistic and a capillary diameter of 10 µm it can be calculated the total cross section area of the capillaries and comparing it to the aorta. My calculation revealed a cross section area of the aorta is 6.6 cm2 and the sum of total cross section area of all capillaries is 2.375 cm2. That is considerably less not more than the aorta.
Section 14: Is a brief statement testifying that the authors of articles [1] and [2] despite the errors have not done anything wrong.
These authors, like the rest of the World, were only misled by the many errors and misconceptions gathered over decades that produced the wrong law and formulae which yield wrong results and conclusions in article [2] and new wrong formulae for calculating plasma flux across the capillary wall and subendothelial glycocalyx space of doubtful existence as reported by the authors [1]. May I offer the authors my humble sincere condolence commiserating apology for spending their career life defending the wrong Starling’s law and RSP paradigm. This is said to authors who defend Starling’s law or RSP being only misled by the many errors and misconceptions gathered over the decades, testifying that they have not done anything wrong.
All interested, knowledgeable and expert authors are invited to work on developing suitable equation (s): One for calculating the FP and RBCs speed or CBS gradient along the G tube, and another equation for the SP acting on the tube’s wall in a perpendicular circular plane causing the magnetic field-like flow dynamics of the G tube (Figure 5 SI) and the capillary that account for fast exchange of fluid, oxygen and nutrients between capillary lumen and ISF space for the benefit of the cells. I would personally nominate any researcher person or team who delivers and report the correct equation (s) first for the big and great Noble Prize as a consolation prize.
Section 15: Is a sincere cordial invitation to all authors in support of Starling’s hypothesis and RSP to do the calm and honorable act of accepting the new G tube Theory working on Capillary-ISF Transfer.
A consolation Noble Prize that I would recommend for a person or team of investigators on producing the equation for the G tube hydrodynamics and capillary hemodynamic might be theirs.
Section 16: Is expressing being in big financial and gratitude debt to editors of Open Access Journals who accepted and reported after peer review all my 65 articles so far without paying any APCs at all. A thank you note to all peer reviewers is advanced.
I promise to pay my financial debt to all journals for APC when I have the money.
Section 17: Is a CONCLUSION with an added invitation to the concerned scholars of the world to please vote for me:
Acting like a politician for once in my life, may I ask all scholars peers of editors, peer reviewers and readers of this article, please, vote for me by nomination for Noble Prize for discoveries in physics, physiology and medicine summarized here [12] and detailed here [7-11,13-17], and on top of it all this Crown article you are reading now. This was an impossible mission successfully made possible and concluded to a great satisfaction. That is one thing I cannot do myself as self-nomination for Noble Prize is not allowed. Many thanks to all concerned. I see the issues so clearly now; I must be standing on the shoulders of Giants.
Finally, if after reading the above evidence on the correctness of the G tube theory as replacement for Starling’s law, one remains unconvinced, then there is nothing neither I nor anybody else can do to help him. Most probably such person is blessed with a high state of blissful ignorance, he will most probably die with it. The conclusion of this article follows later.
Methods
The lumen pressure (LP) of fluid passing in a tube was found to have not just one hydrostatic pressure at any one point but two dynamic LP components: the flow pressure (FP) responsible for the flow and the side pressure (SP) exerted on the tube’s wall. Both FP and SP are induced by proximal pressure akin to arterial pressure. The flow pressure is high positive pressure measured with a cannula or needle facing upstream. The side pressure is positive gradient lower than FP in Poiseuille’ tube and is negative pressure gradient in the G tube measured with a cannula or needle facing sideways or downstream. Furthermore, SP in the G tube induces suction causing absorption of fluid not filtration maximum near the inlet.
The G tube is made of plastic tube of 7 mm inner diameter and 100 mm long that has multiple holes in its wall and is fitted with orifice at the inlet that range in diameter from 2 to 6 mm. It was built on a scale to the capillary ultrastructure of having precapillary sphincter and wide intercellular holes. An orifice of 5 mm was the best for producing the phenomenon of the G tube. The inflow PP (akin to arterial pressure) and orifice (akin to precapillary sphincter) induce a fluid jet in the G tube lumen causing LP that has 2 dynamic pressure components: Flow pressure (FP) is a positive component responsible for the flow and takes its direction.
Side pressure (SP) is a negative pressure gradient exerted on G tube’s wall responsible for suction in proximal part of the G tube. This SP also exist in Poiseuille’s tube and is lower than FP (Figures 17, 18, SI).
The negative side pressure of a fluid jet inside the G tube is an extension of the well-known Venturi’s effect and Bernoulli’s principle. The speedy fluid jet runs for a distance inside the G tube’s wide lumen inducing the negative SP gradient that causes suction over the proximal part near the inlet causing suction or absorption, and turns positive maximum near the exit, causing filtration. Both filtration and suction are unique, autonomous, dynamic, and fast effects of the flow jet of the G tube (Figure 5 SI) based on many photographs presented here. The G tubes with various orifice diameters ranging from 2 to 6 mmm (Figure 3 SI) were used for measuring the effect of changing orifice diameter on SP and CP. In all other measurements experiments an orifice of 5 mm was used in a G tube with 7 mm diameter that induces the most efficient G-C phenomenon.
The surrounding chamber (C) around the G tube is also made of bigger plastic tube fitted with manometers that measure pressure at inlet and exit of the G tube and at various parts of chamber (C) that also has net negative pressure, and the fluid inside it runs in an opposite direction to the G tube fluid flow in the circulatory system.
The new results of the G tube presented here are based on intellectual analytical insightful interpretation of the previously reported G tube results and (Figures 1-18 reproduced in SI).
Conclusion
This article presents the final definitive proof that Starling’s law is wrong, and the correct replacement is the hydrodynamic of the G tube. The presented evidence is based on reported and new results of the G tube hydrodynamic and critical analytical criticism of landmark and contemporary impactful articles, demonstrating many errors and misconceptions occurring while Starling’s hypothesis was being transformed into a law with equations. Received wisdom on cross section area of the whole number of capillaries is larger than of the aorta is proved wrong and the RBCs speed in the capillaries being “too slow” is also proved wrong. Unquestionable evidence to show Starling’s law is wrong and the revised Starling’s principle is futile are given.
The hydrodynamics of the G tube was prelimenary reported in 2001, emphasized in 2017 and the plenary evidence in 2020 demonstrating its relevance to the haemodynamics of the capillay as well as its clinical significance proposing the G tube phenomonon of magnetic fieeld-like fluid circulation between the capillary lumen and ISF space as the correct replacement for Starling’s law.
Contributions on the subject of G tube physics and capillary physiology as well as identifying the 2 new volumetric overload shocks (VOS), and resolving the puzzle of ARDS are mentioned. Not only the exact patho-aetiology of ARDS was identified but also a possible prevention and curable therapy is advanced and recommended. So, ARDS is not caused only by sepsis and COVID-19 but also by VOS. Sepsis is managed by appropriate and adequate antibiotics, Covid-19 is transient and will soon go away or a vaccination will materialize to eradicate it while ARDS induced by VOS shall remain unless Starling’s law is disposed off, better policy on fluid therapy is implemented and every practicing physician in the World particularly those involved in fluid therapy knows about it.
The results of the presented study clearly indicate and recognize the following new discoveries of the G tube:
There is a major difference between the hydrodynamic of Poiseuille’s tube and that of the G tube. There is also a difference between the hydrostatic and hydrodynamic pressures of FP and SP.
The lumen pressure components of the dynamic fluid flow of FP and SP are precisely identified and measured in both Poiseuille’s tube and the G tube.
The SP in the G tube causes negative pressure gradient exerted on the wall maximum near the inlet and turns positive pressure maximum near the exit.
Thus, in the G tube suction or absorption of fluid occur through side holes near the inlet while filtration occurs through holes near the exit.
This creates the unique autonomous rapid dynamic magnetic field like fluid circulation in a surrounding chamber (C) between fluid around the G tube and fluid inside its lumen.
The negative SP of the G tube creates net negative pressure in surrounding chamber (C).
The flow in chamber C is in the opposite direction to the flow of fluid in the G tube lumen.
The G tube’s magnetic field like fluid circulation phenomenon between fluid inside its lumen and that surrounding it in chamber C works in both macro and micro tubes alike as based on the physiological evidence and presented evidence.
The presumed slow RBCs speed as it passes through the capillary is incorrect. The RBCs speed or CBS is 8.7 mm/s at the pre-capillary sphincter and 4.7 mm/s at the exit of the capillary reported in rats and in humans. The speed gradient between the two recorded speeds is that that matters in inducing the G tube magnetic field like phenomenon in the capillary irrespective of the variable RBCs speeds in value.
The RBCs speed or CBS run down a slope of gradient from pre-capillary sphincter to exit of the capillary, from 8.7 mm/s to 4.7 mm/s. This speed gradient induces the magnetic field-like flow phenomenon of the G tube between the blood flow in capillary lumen and the surrounding ISF space. This FAST capillary-ISF transfer is essential for the viability of tissues and cells under resting conditions and strenuous exercise. Substantial evidence on this issue with supporting graphs is reported particularly as the driving pressure in the capillary of 32 mmHg [2] is higher than that in the G tube of 24 cm water.
The hydrodynamics of the G tube demonstrate that the dynamic pressure of a moving fluid has 2 pressures components that are different from the hydrostatic pressure of a stagnant fluid:
The flow pressure (FP) is in the direction of flowing fluid measured with a cannula or needle facing up stream. It exists in both Poiseuille’s and the G tube and is high positive pressure.
The side pressure (SP) is lower than FP in Poiseuille’s tube and is measured with a cannula or needle facing downstream or sideways.
The negative SP gradient is unique to the G tube causing suction over the proximal part of the G tube maximum near the inlet that turns gradually into positive pressure gradient maximum near the exit that causes filtration.
Both FP and SP of a dynamic flow are different from the hydrostatic pressure measured with a cannula occluding the lumen of the tube. This is generally known as the MEASURED hydrostatic pressure (MHP) of the tube flow as measured by Landis in the capillary of 32 and 12 mmHg at arterial and venous ends respectively, which induce SP gradient that induces the magnetic field-like flow phenomenon of the G tube in the capillary and the surrounding ISF space.
In the G tube suction or absorption of fluid occur through side holes near the inlet while filtration occurs through holes near the exit. This creates an autonomous rapid dynamic magnetic field like fluid circulation in a surrounding chamber (C) between fluid around the G tube inside C and fluid inside its lumen. The negative SP of the G tube creates net negative pressure in chamber (C). The flow in chamber C is in the opposite direction to the flow of fluid in the G tube lumen. This magnetic field-like fluid circulation (Fig. 5) regulates the fast capillary-ISF transfer that can provide for the cell’s viability at rest and during exercise, not the slow perfusion.
It is time for a farewell: “Goodbye Starling’s law, hello G tube.”
Acknowledgements
Many thanks go to Designer Engineer Peter Holder of Eastbourne who provided endless supply of G tubes free of charge before 1985. I thank Mr Brian J Stoodley and Mr Peter Brooks, Consultant surgeons for offering me the registrar post in 1983 without attending the interview being at FRCS Ed examination at the time and for teaching me all the surgery I know. Many thanks go to Mr JP Ward and the late Mr KC Perry, Consultant Urologists, District General Hospital, Eastbourne, UK for teaching me the Urology I know, and for offering me the post of research fellow without an interview in order to do the prospective study on the TURP syndrome [17].
I like to mention and thank the following late professors for being most kind and helpful with supportive encouraging letters: I thank the late Professor GD Chisholm, Editor of British Journal of
Urology for reporting my article [17] and a nice encouraging letter. Many thanks also to the late
Professor Dr, David Horrobin, physiologist who was the editor-in-chief of the journal Medical Hypotheses and founder in 1975 until his death in 2003 for accepting and reporting my article [8] free of charge. Many thanks to the late Professor Dr, Eric Neil, physiologist author of Samson Write Textbook of Physiology for a nice encouraging letter who specially handwritten it for me during his retirement.
I also like to mention Mr and Mrs Robert and Freda Prentice of 70 Glendale Avenue, Eastbourne, East Sussex BN21 1UD in the UK, good friends who performed like my family in the UK and for permitting the use of their home and garden for conducting the G tube experiments. I thank my family members: My wife Nannah Abdullatif Kamel and my children, Sara, Khaled and Salma and my sister-in-law Monera Abdullatif Kamel for tremendous support and looking after me well. Dr Khaled A Ghanem, MBBCh for his input in editing this article, for buying me a new Laptop and Office 365. Dr Salma A Ghanem, MBBCh, for payment of $200 on my behalf to the scamsters who ripped me of it posing as conference organizers. I thank Monera for taking care of me when Nannah was away and for gifting me with a nice small house Croton tree to use for validating the Tree Branching Law.
I also like to thank the Internet people, Google for its magic Chrome® and Google Scholar® programs, and the people behind the wonderful PubMed, NLM & NCBI for being most helpful over the years; putting such huge amount of information at the researcher’s finger’s tip- though unhappy with them not referencing Open Access Journals. I like to thank Apple® Computers for inventing the Macintosh® before 1985 and Stat View® 512+ Statistical package; both made analysing the data of the prospective study and the G tube experiments absolute fun between 1984-1988. I thank Microsoft for Office 365 and Windows 10. I thank the authors of free programs such as Picasa, Acrobat Reader and Paint.
Conflict of interest: None declared by the author.
Funds received during research and writing of all reports: None declared by the author.
Dear Editorial Team, Clinical Medical Reviews and Reports. My experience with the journal was highly positive. The peer-review process was rigorous, constructive, and completed in a timely manner. The reviewers provided valuable comments that helped improve the quality and clarity of our manuscript. The editorial office was professional, responsive, and supportive throughout all stages of the publication process. Communication was clear and efficient, and any questions were addressed promptly. Overall, I found the journal to maintain high scientific standards and an excellent publication workflow. I would be pleased to consider submitting future work to this journal. Best wishes from, Elena Popa.

It was my pleasure to submit my testimonial concerning the Reviewer Board of our Scientific Journal “Brain and Neurological Disorders”. The Reviewers focused on some modifications and their contribution was helpful. The ladies of our Editorial Office were also supported my efforts. It was my honor to have such a co-operation and I am looking forward for more collaboration.

Dear Grace Pierce, Editorial Coordinator of Journal of Clinical Research and Reports, Thank you for the speedy and efficient peer review process. I appreciate the fact that your peer reviewers do not take months to respond like with some other journals. I would also like to thank the editorial office for responding quickly to my questions. It is an excellent journal. I plan to submit more manuscripts in the future. Best wishes from, Robert W. McGee

Dear Grace Pierce, Editorial Coordinator of Journal of Clinical Research and Reports, Working with you and your team on our recent publication in JCRR has been a truly wonderful and enjoyable experience. The responses were prompt, and the reviewers were patient, constructive, and highly professional. One reviewer in particular gave me the feeling that a professor was carefully reading and commenting on my coursework, which was deeply touching. The entire process was straightforward and hassle‑free, with no tedious online forms to complete. I highly recommend this journal. Best wishes from, DR Aibing Rao, Head of R&D

I Appreciate the Opportunity to Share my Experience with the Journal of Clinical Research and Reports. The peer review process was timely and constructive, and the feedback provided helped improve the quality of our manuscript. The editorial office was professional, responsive, and supportive throughout the process, ensuring smooth communication and efficient handling of the submission. Overall, it was a positive experience collaborating with your team.

Dear Mercy Grace, Editorial Coordinator of Obstetrics Gynecology and Reproductive Sciences, We would like to express our gratitude for your help at all stages of publishing and editing the article. The editors of the magazine answer all the necessary questions and help at every stage. We will definitely continue to cooperate and publish other works in the Obstetrics Gynecology and Reproductive Sciences! Best wishes from, Alla Konstantinovna Politova,
