AUCTORES
Globalize your Research

Research Article | DOI: https://doi.org/10.31579/2641-0419/458
1Student Research Committee, Golestan University of Medical Sciences, Gorgan, Iran.
2Neonatal and Children’s Health Research Center, Department of Pediatric, Gorgan Faculty of Medicine, Golestan University of Medical Sciences, Gorgan, Iran.
3Health Management and Social Development Research Center, Dep. of Biostatistics, Gorgan Faculty of Medicine, Golestan University of Medical Sciences, Gorgan, Iran.
4Neuroscience Research Center, Department of Physiology, Faculty of Medicine, Golestan University of Medical Sciences, Gorgan, Iran.
*Corresponding Author: S. Mehran Hosseini, Neuroscience Research Center, Department of Physiology, Faculty of Medicine, Golestan University of Medical Sciences, Gorgan, Iran.
Citation: Kiana Habibizadeh, Hassan Esmaeili, Mohammad Ali Vakili, and S. Mehran Hosseini, (2025), QRS Dispersion Index During Tilt Test in Patients with Transient Loss of Consciousness, J Clinical Cardiology and Cardiovascular Interventions, 8(4); DOI: 10.31579/2641-0419/458
Copyright: © 2025, S. Mehran Hosseini. This is an open access article distributed under the Creative Commons Attribution License, which permits unrestricted use, distribution, and reproduction in any medium, provided the original work is properly cited
Received: 03 March 2025 | Accepted: 11 March 2025 | Published: 19 March 2025
Keywords: QRS dispersion; tilt test; electrocardiogram; syncope
Objectives: The QRS dispersion index (QRSd) is the difference between the minimum and maximum duration of the QRS complex. QRSd is reported to have prognostic values and is associated with arrhythmias and mortality. There is a lack of information regarding QRSd changes during the tilt test (TT). This study was conducted to determine the QRSd changes during TT in patients with transient loss of consciousness.
Methods: This descriptive-analytical study was conducted retrospectively. The QRSd was compared in the three stages of the TT: rest (baseline), tilt, and recovery. Repeated measure ANOVA was used for normally distributed variables; otherwise, Friedman's nonparametric test was used, and Bonferroni's adjusted test was used for pairwise comparisons in subgroups.
Results: The mean and standard deviation of QRS complex duration in milliseconds (QRSt) in baseline, tilt, and recovery were 0.105±0.011, 0.099±0.015, and 0.103±0.013 in negative TT and 0.106±0.015, 0.099±0.017, and 0.170±0.103 in positive TT, respectively. There was a significant difference between baseline and tilt in the negative group and between baseline and tilt, and tilt and recovery in the positive group (P<0.05). The mean and standard deviation of QRSd in both groups between baseline, tilt and recovery were 0.035±0.009, 0.033±0.01 and 0.027±0.01 in negative TT and 0.039±0.013, 0.039±0.013 and 0.025±0.009 in positive TT, respectively. A significant difference was found between baseline and recovery in the negative group (P=0.048) and between baseline and recovery, and tilt and recovery in the positive group. (P<0.05). In women with positive TT, the QRSt was significantly different between baseline and tilt (P=0.005). This difference was not observed in men with positive TT. In the positive TT group, the comparison of QRSt and QRSd in sex and age subcategories had significant differences. This finding was not observed in the negative TT group.
Conclusions: Patients with positive and negative TT have different QRSd changes. TT-induced QRSd changes may be sex and age- dependent. Hemodynamic-autonomic reflexes during TT are associated with increased inhomogeneity of conduction velocity during ventricular depolarization.
According to the American College of Cardiology (ACC) and American Heart Association (AHA) guidelines, ECG is recommended as a class 1 procedure for the evaluation of syncope patients [1]. The ECG provides valuable information in evaluating cardiac repolarization and depolarization during sinus rhythm, as well as morphological changes of the QRS complex during ventricular arrhythmias [2]. Some electrocardiographic indices are useful in the diagnosis and treatment of patients with a history of syncope [3] The QRS dispersion (QRSd) is a simple electrocardiographic index with potential value in the evaluation of patients in various clinical settings. The QRSd is the difference between the minimum and maximum durations of the QRS complex [4]. Depolarization abnormalities are associated with the degree of endocardial conduction delay and scarring, leading to an increase in QRSd, which may reflect more extensive tissue damage and delayed conduction [2]. In patients with arrhythmogenic right ventricular cardiomyopathy, QRSd values equal to or greater than 40 milliseconds have been reported to be the strongest independent predictor of sudden death among other indicators studied [5]. Higher QRSd values are associated with increased mortality in heart failure patients and are associated with more risk of arrhythmias in patients with cardiomyopathy. In a study with a sample size of 6510 cardiac patients, it was reported that QRSd values greater than 34 milliseconds are significantly associated with mortality, and severe adverse cardiac events [6].
Tilt test (TT) is clinically useful in the evaluation of patients with a history of transient loss of consciousness and/or other similar conditions, including orthostatic intolerance (7, 8). Many studies have reported that patients with positive TT results are prone to arrhythmias (9, 10). However, due to the high rate of false-positive TT responses, the application of TT findings for therapeutic decision-making is not universally accepted [11, 12]
Changing body position, especially from the horizontal to the vertical axis, affects the hemodynamics of the cardiovascular system. At the same time, due to the distinct effect of gravity on the diastolic filling and systolic emptying on the right and the left ventricles, as well as the activation of baroreceptor reflexes and changes in sympathovagal tone, some features of the electrocardiogram will be affected. We do a complete and precise literature review of available scientific databases including PubMed and Scopus but we cannot find any report regarding the QRSd changes during TT in patients with transient loss of consciousness. This study was conducted to determine the QRSd changes during TT in these patients.
In this retrospective descriptive-analytical study we collected data from 40 patients’ files. The study protocol was confirmed by the research council of Golestan University of Medical Sciences. The ethic number was ir.goums.REC.1403.008. These files were selected from 390 files according to inclusion and exclusion criteria. All patients had performed TT. Inclusion criteria were no cardiac arrhythmia, no use of cardiovascular medications at the time of TT, and no history of chronic diseases or hospitalization. Exclusion criteria included cases in whom TT was performed differently from other patients due to clinical conditions or the need for drug administration during TT. Selected files were divided into two groups: first 20 files with positive TT were selected then 20 age and sex-matched files with negative TT were selected. The ECG was recorded under standard conditions of paper speed of 25 mm/s and calibration of 10 mm/mV. Lead 2 was used for ECG data collection during the three TT phases including baseline, tilt and recovery. In the baseline phase, five minutes before the start of the tilt, in the tilt phase, as soon as the tilt started, and in the recovery phase, after reaching the horizontal position, the ECG parameters were considered for calculation [4, 13].
For statistical analysis, the normality of data was determined with the Shapiro-Wilk test. In cases where the normality assumptions were met, the test of analysis of variance with repeated measures was used, and in other cases, the nonparametric Friedman test was used. For pairwise comparisons in subgroups, we used the Bonferroni-adjusted test. The significance level of all tests was considered to be 0.05. The collected data were analyzed with SPSS version 22 software.
There were 10 women (50%) and 10 men (50%) in the positive TT group and 11 women (55%) and 9 men (45%) in the negative TT group. The mean ± standard deviation of age were 32.55±19.28 and 32.40±18.93 years in positive and negative TT groups respectively. There was no statistically significant difference between the baseline values of QRSt and QRSd among positive and negative TT groups. The mean and standard deviation of QRSt and QRSd in baseline, tilt, and recovery states are shown in Tables 1 and 2, respectively

Table 1: Comparison of the mean ± standard deviation of QRSt during the baseline, tilt, and recovery states in positive and negative TT groups (n=40).
Non-Parametric Friedman test.
**Bonferroni’s-adjusted test.
B: baseline, T: tilt, R: recovery, Min: minimum, Max: maximum, SD: standard deviation.
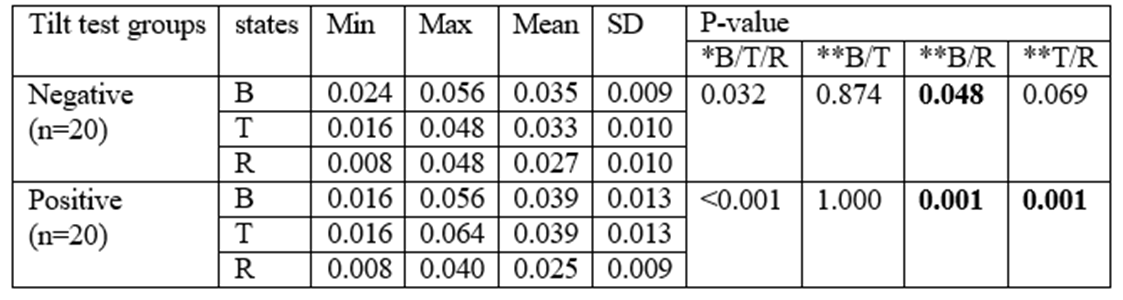
Table 2: Comparison of the mean ± standard deviation of QRSd during the baseline, tilt, and recovery states in positive and negative TT groups (n=40).
B: baseline, T: tilt, R: recovery, Min: minimum, Max: maximum, SD: standard deviation.
*Analysis of Non-Parametric Friedman test.
**Bonferroni’s-adjusted test.

Table 3: presented a detailed comparison of the mean and standard deviation of QRSt values across three distinct states: baseline, tilt, and recovery. This analysis was further broken down by sex and included data for both the negative and positive TT groups.
B: baseline, T: tilt, R: recovery, Min: minimum, Max: maximum, SD: standard deviation.
*Analysis of Non-Parametric Friedman test.
**Bonferroni’s-adjusted test.
Table 4 presented a detailed comparison of the mean and standard deviation of QRSd values across three distinct states: baseline, tilt, and recovery. This analysis was further broken down by sex and included data for both the negative and positive TT groups.

Table 4: Comparison of the mean ± standard deviation of QRSd during the baseline, tilt, and recovery states between sexes in positive and negative TT groups (n=40).
B: baseline, T: tilt, R: recovery, Min: minimum, Max: maximum, SD: standard deviation.
*Analysis of Non-Parametric Friedman test.
**Bonferroni’s-adjusted test.
In women with positive TT, the QRSt had a significant difference between baseline and tilt (P=0.005). In men with positive TT, there was no significant difference. In both sexes with positive TT, the QRSd had statistically significant difference between the baseline and recovery and between tilt and recovery (P<0>
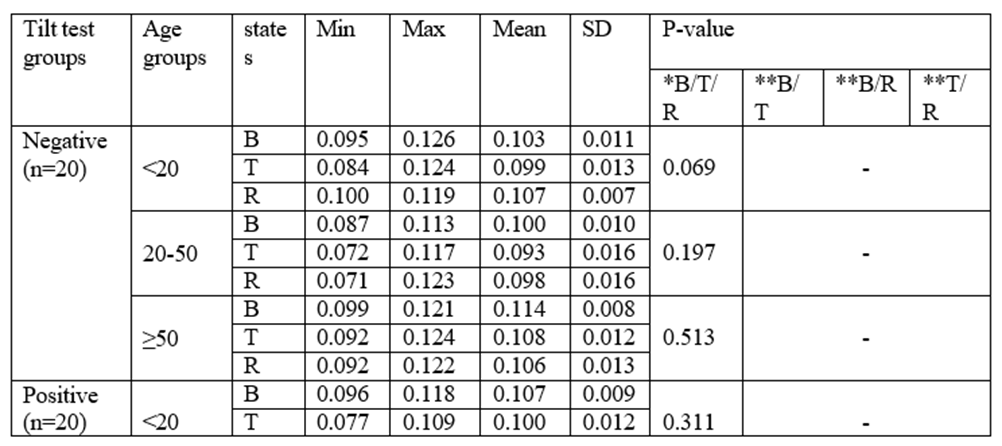
Table 5: Presented the mean and standard deviation of QRSt values across three distinct states: baseline, tilt, and recovery.
This analysis was further broken down by age clusters and included data for both the negative and positive TT groups.
B: baseline, T: tilt, R: recovery, Min: minimum, Max: maximum, SD: standard deviation.
*Analysis of Non-Parametric Friedman test.
**Bonferroni’s-adjusted test.
Table 6: presented the mean and standard deviation of QRSd values across three distinct states: baseline, tilt, and recovery.
This analysis was further broken down by age clusters and included data for both the negative and positive TT groups.
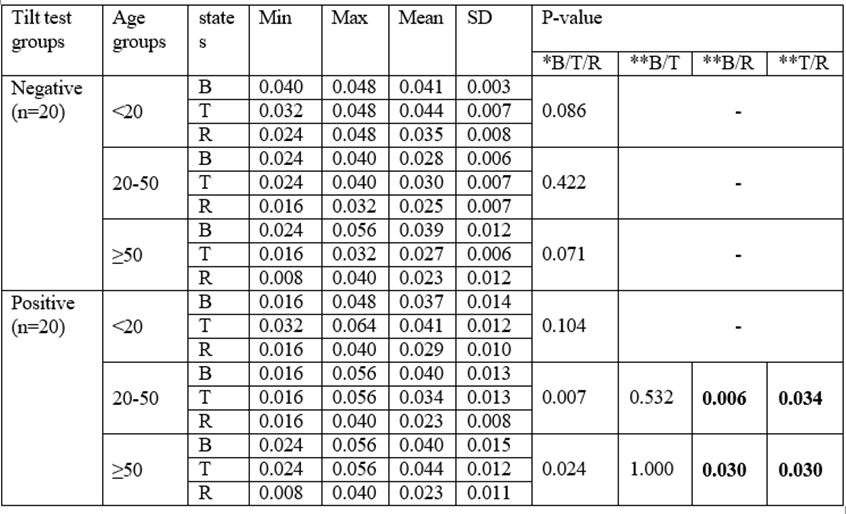
Table 6: Comparison of the mean ± standard deviation of QRSd during the baseline, tilt, and recovery states among age clusters in positive and negative TT groups (n=40).
B: baseline, T: tilt, R: recovery, Min: minimum, Max: maximum, SD: standard deviation.
*Analysis of Non-Parametric Friedman test.
**Bonferroni’s-adjusted test.
In patients aged older than 20 years who had positive TT, the QRSt had statistically significant difference between the baseline and tilt. In patients aged 20 to 50 years the QRSt had also statistically significant difference between the tilt and recovery (P<0>
There were 10 women (50%) and 10 men (50%) in the positive TT group and 11 women (55%) and 9 men (45%) in the negative TT group. The mean ± standard deviation of age were 32.55±19.28 and 32.40±18.93 years in positive and negative TT groups respectively. There was no statistically significant difference between the baseline values of QRSt and QRSd among positive and negative TT groups. The mean and standard deviation of QRSt and QRSd in baseline, tilt, and recovery states are shown in Tables 1 and 2, respectively
Table 1: Comparison of the mean ± standard deviation of QRSt during the baseline, tilt, and recovery states in positive and negative TT groups (n=40).
Non-Parametric Friedman test.
**Bonferroni’s-adjusted test.
B: baseline, T: tilt, R: recovery, Min: minimum, Max: maximum, SD: standard deviation.

Table 2: Comparison of the mean ± standard deviation of QRSd during the baseline, tilt, and recovery states in positive and negative TT groups (n=40).
B: baseline, T: tilt, R: recovery, Min: minimum, Max: maximum, SD: standard deviation.
*Analysis of Non-Parametric Friedman test.
**Bonferroni’s-adjusted test.
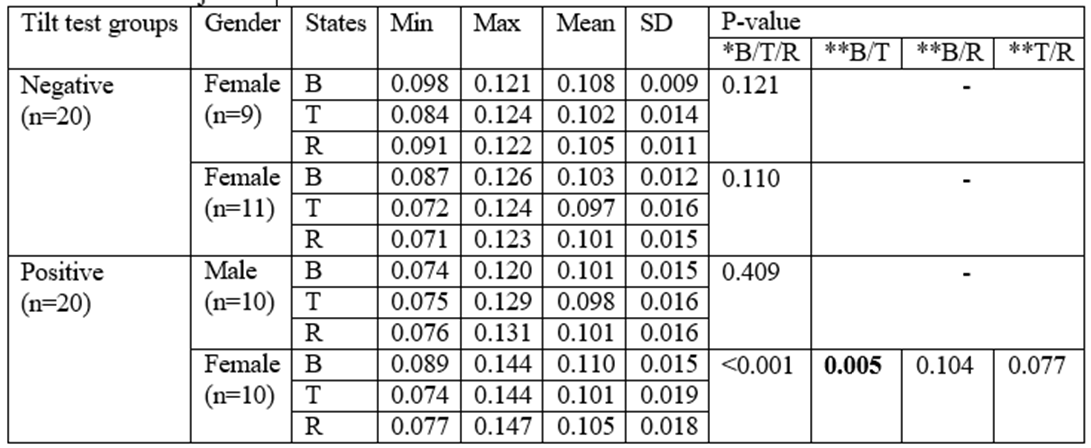
Table 3: presented a detailed comparison of the mean and standard deviation of QRSt values across three distinct states: baseline, tilt, and recovery. This analysis was further broken down by sex and included data for both the negative and positive TT groups.
B: baseline, T: tilt, R: recovery, Min: minimum, Max: maximum, SD: standard deviation.
*Analysis of Non-Parametric Friedman test.
**Bonferroni’s-adjusted test.
Table 4 presented a detailed comparison of the mean and standard deviation of QRSd values across three distinct states: baseline, tilt, and recovery. This analysis was further broken down by sex and included data for both the negative and positive TT groups.
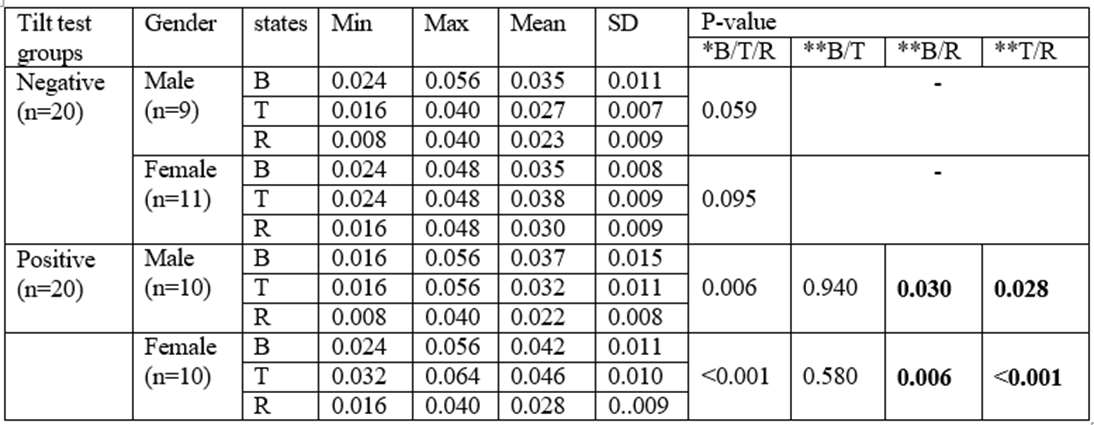
Table 4: Comparison of the mean ± standard deviation of QRSd during the baseline, tilt, and recovery states between sexes in positive and negative TT groups (n=40).
B: baseline, T: tilt, R: recovery, Min: minimum, Max: maximum, SD: standard deviation.
*Analysis of Non-Parametric Friedman test.
**Bonferroni’s-adjusted test.
In women with positive TT, the QRSt had a significant difference between baseline and tilt (P=0.005). In men with positive TT, there was no significant difference. In both sexes with positive TT, the QRSd had statistically significant difference between the baseline and recovery and between tilt and recovery (P<0>

Table 5: Presented the mean and standard deviation of QRSt values across three distinct states: baseline, tilt, and recovery.
This analysis was further broken down by age clusters and included data for both the negative and positive TT groups.
B: baseline, T: tilt, R: recovery, Min: minimum, Max: maximum, SD: standard deviation.
*Analysis of Non-Parametric Friedman test.
**Bonferroni’s-adjusted test.
Table 6: presented the mean and standard deviation of QRSd values across three distinct states: baseline, tilt, and recovery.
This analysis was further broken down by age clusters and included data for both the negative and positive TT groups.

Table 6: Comparison of the mean ± standard deviation of QRSd during the baseline, tilt, and recovery states among age clusters in positive and negative TT groups (n=40).
B: baseline, T: tilt, R: recovery, Min: minimum, Max: maximum, SD: standard deviation.
*Analysis of Non-Parametric Friedman test.
**Bonferroni’s-adjusted test.
In patients aged older than 20 years who had positive TT, the QRSt had statistically significant difference between the baseline and tilt. In patients aged 20 to 50 years the QRSt had also statistically significant difference between the tilt and recovery (P<0>
This study encompassed a total of 40 patient records, which were categorized into two equal groups: 20 individuals exhibiting a positive tilt test and 20 individuals displaying a negative tilt test. The groups were meticulously matched for age and gender to ensure comparability. In the positive TT group, only females showed significant differences in the QRSt, while both sexes exhibited significant differences in the QRSd among baseline, tilt and recovery states. In the negative TT group, the comparison of QRSt and QRSd between sexes and among age clusters hag no significant differences.
In a study conducted by Picchirillo et al. involving 20 healthy subjects, it was found that the TT was associated with changes in certain electrophysiological parameters of the ECG. These changes were linked to increased sympathetic activity and other hemodynamic reflexes. The study reported no significant difference in the duration of the QRS complex; however, both the QT and ST intervals showed an increase. TT temporarily alters the sympathovagal tone, but in healthy subjects, the depolarization indices, including QRS duration and dispersion, as well as intraventricular conduction velocity, did not exhibit significant variations in response to TT. Nonetheless, most repolarization indices showed increased dispersion during TT. The discrepancies between the findings of this study and our own may be attributed to differences in the sample populations. In our study, we assessed patients on a tilt table to investigate the causes of syncope or positional dizziness, while Picchirillo et al. focused on healthy subjects [15]. When interpreting QRSd, it is important to consider the effect of wave amplitude and its relationship to the duration of the complex. Experimental studies have suggested that variations in heart size, attributed to differences in body weight, could influence this phenomenon. However, recent research has emphasized a lack of correlation between body weight and most ECG electrophysiological indices excluding the QRS duration [16, 17, 18]. Additionally, it has been reported that as QRS duration increases, the dispersion index (QRSd) also rises. The QRS duration is a key indicator for assessing intraventricular conduction time. While QRSd reflects ventricular conduction heterogeneity, some recent studies have challenged the connection between this index and the occurrence of cardiac arrhythmias due to underlying heart tissue disorders, instead linking it purely to the increase in QRS duration 919]. It appears that different mechanisms contribute to the dispersion of the QRS complex (QRSd), and their significance may vary across various diseases, leading to differing outcomes in studies. Some researchers have attributed the primary mechanism behind QRSd to the non-uniformity in the propagation of electrical impulses throughout the myocardial thickness. This phenomenon is particularly evident in cases where the QRS time is not prolonged. They suggest that the best explanation for QRSd is the uneven transmission of the ventricular depolarization impulse in relation to the axes used to record the impulses [20]. Heart rhythm disorders are not equally prevalent in both sexes, and the differences in these disorders between genders are well-documented. These differences are largely attributed to the effects of sex hormones on the heart's electrophysiological characteristics. Notably, hormones influence the expression and function of ion channel genes, while the autonomic nervous system and cardiac sympathovagal tone also interact with sex hormones, contributing to these variations.
However, there is limited information regarding how differences in body size and body fat percentage affect the electrophysiological characteristics of the cardiovascular system. Certain electrocardiographic indices, such as heart rate, RR intervals, and QT intervals, vary between women and men. Importantly, these differences cannot be solely explained by variations in body mass index or body surface area between the sexes (16). In the present study, a significant difference was found in the QRSd among patients with a positive TT in both men and women. Furthermore, the QRSt difference was observed exclusively in women within the positive TT group under the three studied conditions.
When generalizing the results of this study, several limitations should be acknowledged. Firstly, the small sample size and the retrospective design of the study are significant factors. Additionally, another limitation was the non-continuous recording of blood pressure and ECG measurements of patients during the baseline, tilt, and recovery states of the TT. Future studies could benefit from continuous monitoring of these parameters, a larger sample size, and improved matching of groups to yield more robust data and results.
Patients with positive and negative TT have different QRSd changes. TT-induced QRSd changes may be sex and age- dependent. Hemodynamic-autonomic reflexes during TT are associated with increased inhomogeneity of conduction velocity during ventricular depolarization
Please use this standard disclosure: The authors declared no conflicts of interest. No funding was received for this study.
The authors wish to thank all patients who participated in the study. This study was the result of a Doctor of Medicine Degree thesis.
This observational study was confirmed by the institutional review board standards at the Golestan University of Medical Sciences, Gorgan, Iran.
Habibizadeh K searched the literature, performed the data collection, contributed to manuscript preparation; Esmaeili H did clinical examination of the participants, contributed to data collection and edited the manuscript; Vakili MA analysed data, contributed to manuscript preparation; Hosseini SM designed the research, performed the data collection, analysed data, wrote the paper.
Clearly Auctoresonline and particularly Psychology and Mental Health Care Journal is dedicated to improving health care services for individuals and populations. The editorial boards' ability to efficiently recognize and share the global importance of health literacy with a variety of stakeholders. Auctoresonline publishing platform can be used to facilitate of optimal client-based services and should be added to health care professionals' repertoire of evidence-based health care resources.